BME100 s2018:Group10 W0800 L6
| Home People Lab Write-Up 1 | Lab Write-Up 2 | Lab Write-Up 3 Lab Write-Up 4 | Lab Write-Up 5 | Lab Write-Up 6 Course Logistics For Instructors Photos Wiki Editing Help | ||||||
OUR COMPANY
Our Brand Name LAB 6 WRITE-UPBayesian StatisticsOverview of the Original Diagnosis System In total, there were 11 BME100 teams working on the products, each of about 3-5 students. Each team tested 2 patients, which is 22 patients total, with three samples for each patient and both a positive and negative control. Measures were taken to prevent error, such as 6 calibration trials with 3 images each to check that the fluorimeter was working properly as well as the camera. Each image was use in ImageJ to not only become sufficient with the program but reduce further error in the lab. Additionally, there were three replicates per patient used to compare with the PCR positive and negative controls. As a result of the lab, conclusions were made for the diagnostic of the patients. Only 10 out of the 11 groups were able to give results, bringing the total number of successful conclusions to be 20. 1/20 of the results, however, was inconclusive. There were 5 total positive conclusions, and 14 total negative conclusions. Out of the total PCRs (60 total because there were three conclusions for each patient), 15 turned out to be positive, 43 turned out to be negative, and 2 were inconclusive. The actual diagnoses gave results of 7/22 positive diagnoses and 15/22 negative diagnoses. Comparing to the actual diagnoses, 60% of our positive diagnoses were correct and 85.7% of our negative diagnoses were correct. As far as problems encountered, our group found minimal problems within our lab process. This was reflected in our results, as our experimental results matched perfectly with the doctor's theoretical results. What Bayes Statistics Imply about This Diagnostic Approach
Intro to Computer-Aided Design3D Modeling Our team decided to use Solidworks for our computer-aided design system. We chose Solidworks over Tinkercad because we had previous experience with Solidworks and thus, our process of design and creating our product went smoothly. Additionally, we were able to use the links provided on Blackboard as we are not completely redesigning the fluorimeter or PCR system. Therefore, we were able to make our necessary adjustments to the original design in a very easy manner. The adjustment our group made was the addition of a ruler system that would make measurements both more accurate and easier to maneuver. Our Design

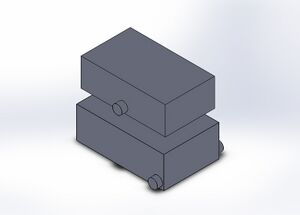
Our design consists of the original fluorimeter machine, however with a new additions or adjustments. Our design features a crank system along the bottom that allows for moving the phone or camera in both vertical and horizontal directions. The crank system will consist of a ruler, sliding about the fluorimeter system, which will also attach the phone or camera at the desired location for picture taking. The use of the ruler and adjustable crank system will give users the most optimal and accurate measurements and make picture taking easier. We chose this design because upon thinking about steps of the process that could be made easier and more accurate, we decided this to be the best place to make adjustments. By adding this maneuvering ruler system, we are able to take better photos and reduce error in measurements.
Feature 1: ConsumablesAs far as consumables, our new and improved fluorimeter design will not require any additional products and will use the same consumables as the previous process. Therefore, reagents such as the PCR mix, primer solution, SYBR Green solution, and buffer will all still be necessary to undergo with this experiment. Also, plastic tubes, glass slides, and micro pipetors will be key ingredients for the lab. Our redesigned fluorimeter does not change anything pertaining to the consumables of the lab, and will only provide adjustments for the camera and ruler placements. Overall, our consumables packaging plan will mimic that of what was given in our lab, as we found no major weaknesses in this area and thus, chose to make improvements within other aspects of the process (the fluorimeter).
Feature 2: Hardware - PCR Machine & FluorimeterOur group has chosen to address the weakness we discovered in the Fluorimeter. Errors occur in measurement of the distance between the camera and the fluorescence, due to the measurement being taken by hand. Implementing a mechanical ruler and a crank system that allows adjustments to be made to the phone and the Fluorimeter will eliminate that error. More accurate calculations and photographs of the glow can be taken and overall improve the quality of the results you get from the device.
| ||||||


