The PCR testing required much pipetting throughout the lab. This was done to transfer the different solution in combinations. The pipetting in this experiment was done effectively as all liquid was transferred from one tube to another in nearly every transfer. The pre-lab reading was very helpful in introducing the concepts and procedures for the lab and explaining what would be done. The difference between the first and second stop on the pipettor was understood by each group member. The first stop is used when collecting a sample and the second stop is used to make sure all of that liquid is completely dispelled. The final reactions had nearly the exact same amount of liquid. There was still some error from tiny drops being separated and slight discrepancies in the amount of solution picked up by the pipettor in some cases as well. There was no liquid left from the DNA samples when mixed with the PCR reaction mix although since there was a significant volume of the combined solution when the droplets were made there was still solution left over in the tubes. We kept the same labeling scheme for the added mix to separate out the controls and each patients respective vials. These were each labelled one through three to designate which tube the solution specifically came from.
Fluorimeter Procedure
Imaging set-up
Place your phone on the cradle at a right angle from the slide.
Stack the Fluorimeter on boxes to reach height equal with the camera.
Place a glass slide on the Fluorimeter
Adjust the distance between the smartphone on its cradle and the first two rows of the slide so that it is as close as possible without making the image blurry. It should be at least 4 cm away from the drop.
Record the distance between your smart phone cradle and drop using the ruler provided in lab. Be careful not to move the camera, cradle, or fluorimeter very much. The light collected will change slightly if there is a significant difference from one image to the next in these distances.
Place a 160 microliter drop of water (H2O) in the middle of the first two rows of the slide using the pipettor
Turn on the excitation light using the switch
Place an upside down box over the phone and Fluorimeter set up in order to block out light
Fold up one flap by the camera and set the camera on a timer
Set timer for the picture and close flap and wait for the picture to take
repeat steps 6-10 for all trials by taking water droplet off with the pipettor each time and adding the new drop on a clean portion of the glass slide and adjusting the slide so the light will go through the droplet.
Placing Samples onto the Fluorimeter
Contents needed:
8 Tubes marked with red dots (500 microliters of Buffer)
2 Tubes labeled S (1,000 microliters of SYBR Green Solution)
1 Tubed labeled H2O (1,000 microliters of Water; pH of 8)
Get your PCR reaction samples (8 total) from the instructors (Note the label you wrote on each tube)
Label each RED DOT (Buffer) tube to match each of the PCR Reaction Sample labels
Set micropipettor to 120 microliters. (Note: setting the pipettor to an extra 20 uL provides extra suction to ensure that you draw up all 100 uL of the PCR sample.)
Attach a disposable tip
Transfer all 100 microliters of the liquid from your PCR tubes into the bigger Buffer tube with the same label
Discard the micropipette tip
Close the cap of the bigger tube and invert the tube to mix the DNA with the buffer. Return this tube to the tray.
Repeat steps 5 through 9 for the other 7 PCR reaction tubes
Placing droplets on Fluorimeter:
Make sure the glass slide is hydrophobic side facing up
Set pipettor to 80 microliters
Put on new pipettor tip and transfer 80 microliters of the PCR mix with DNA sample or control (depending on trial) to the glass slide between the two middle dots
With a new tip, transfer 80 microliters of SYBR green into the drop already on the slide
Take three pictures of the sample by using a timer and closing the box to block light
Repeat steps 2-5 for each solution, making sure to remove the previous trial using the pipettor and using a new portion of the glass slide.
Data Collection and Analysis
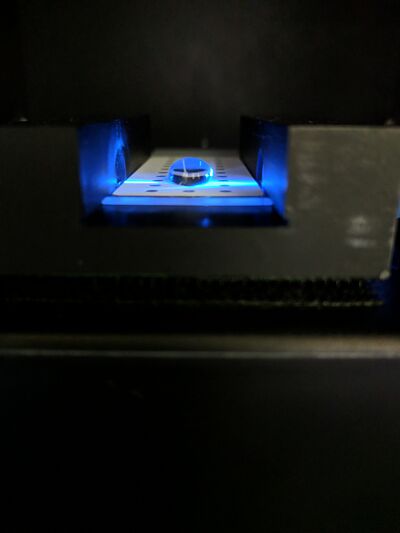
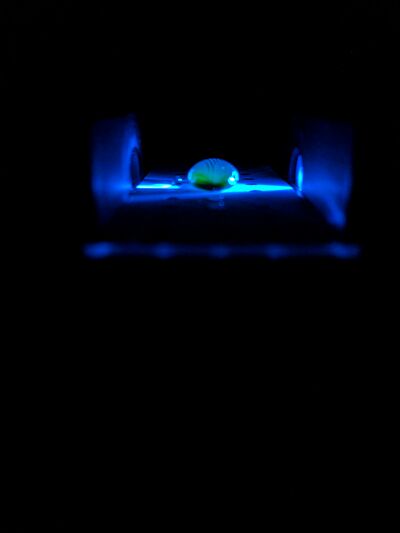
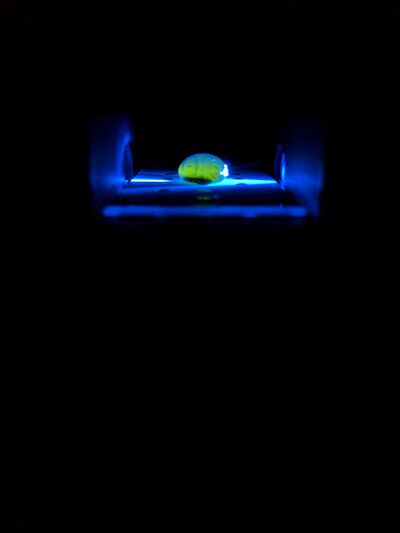
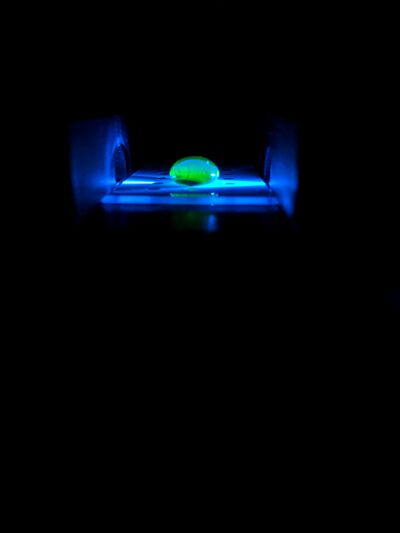
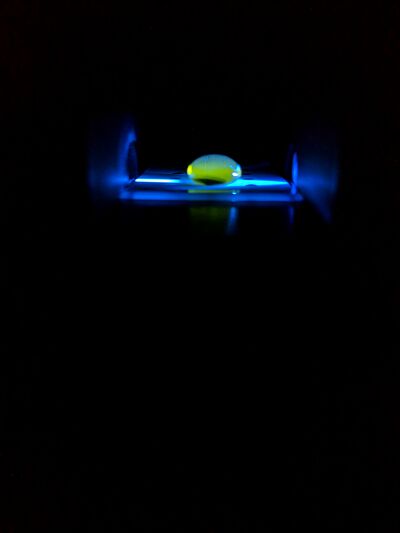
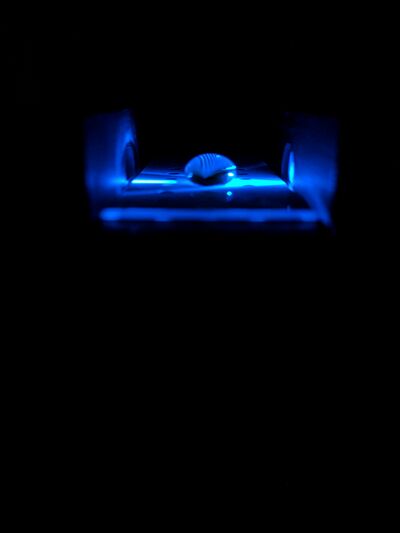
Images of High, Low, and Zero Calf Thymus DNA
Calibrator Mean Values
Initial Concentration of 2X Calf Thymus DNA solution (micrograms/mL)
Final DNA concentration in SYBR Green I solution (µg/mL)
Sample Number
RAWINTDEN DROP - BACKGROUND
MEAN
Standard Deviation
Image 1
Image 2
Image 3
5
2.5
C-1
11545484
12476300
10943889
11655224.33
772077.1165
2
1
C-2
10608842
10776070
9458405
10281105.67
717369.2154
1
0.5
C-3
8476046
8577933
7443342
8165773.667
627714.8038
0.5
0.25
C-4
7683372
6816383
7587838
7362531
475383.9656
0.25
0.125
C-5
8145502
8369532
8401659
8305564.333
139545.6877
0
0
C-6
4376260
4913230
4910604
4733364.667
309264.5004
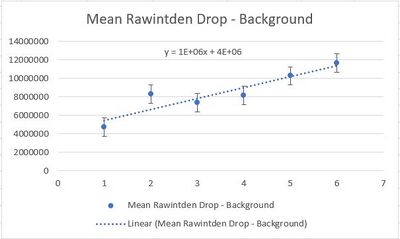
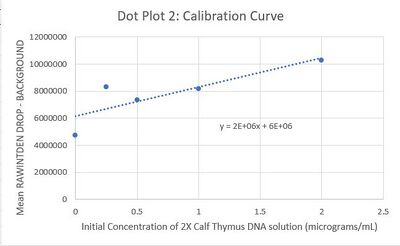
Calibration curves
Images of Our PCR Negative and Positive Controls
PCR Results: PCR concentrations solved
PCR Product TUBE LABEL
MEAN (of RAWINTDEN DROP - BACKGROUND)
"PCR Product Concentration (µg /mL)
(Step 5 calculation)"
Total Dilution
"Initial PCR Product Concentration
(µg /mL)
(Step 6 calculation)"
PC
10706157
6.706
12
80.472
NC
4441480
0.441
12
5.292
P 1-1
4763835
0.764
12
9.168
P 1-2
3103709
-0.896
12
-10.752
P 1-3
3631141
-0.369
12
-4.428
P 2-1
3602752
-0.397
12
-4.764
P 2-2
3497209
-0.503
12
-6.036
P 2-3
5340864
1.341
12
16.092
PCR Results: Summary
Our positive control PCR result was 80.472 μg/mL
Our negative control PCR result was 5.292 μg/mL
Dot Plot 1
the x axis is Initial Concentration of 2X Calf Thymus DNA solution (micrograms/mL)
Dot plot 2:
Chart_2_for_plot_2.JPG
Observed results
Patient 25053 : During the experiment this image had very little green light in the image. Additionally, there was only an average of 8.116 μg/mL of PCR for the three samples.
Patient 57814 : During the experiment this patient's specimen also had very little green light in the image. This patient also only displayed an average of 8.964 μg/mL for the three samples.
Pictures:
The pictures below are in the order of conentration from 1, 2, 5, then the positive control and finally the negative control.
Conclusions
Patient 25053 : This patient is negative, because it is dramatically closer to 5.292 than to 80.472, which are the positive and negative controls respectively.
Patient 57814 : This patient is also negative, for the same reason, that the value of 8.964 μg/mL is dramatically closer to 5.292 than to 80.472.