IGEM:IMPERIAL/2009/M3/Assays/Promoter characterisation
Promoter Characterisation
Aims
- To test and characterise the lambda cI promoter
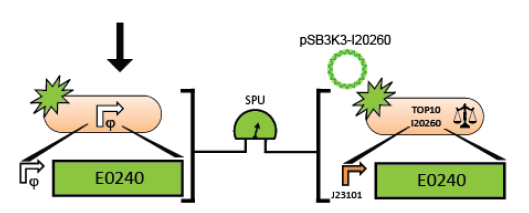
- By linking the promoter to the BBa_E0240 testing construct (RBS-GFP-TT), a quantitative measurement of the fluorescence over time can be directly obtained. This will then be converted to the relative transcriptional activity of the promoter (RPU).
Assay
To characterise the promoters, a promoter measurement kit will be used.[1]
The Assembly Instructions describe a method to insert a test promoter into the promoter test construct by combining the test promoter with the GFP reporter device (BBa_E0240) and the backbone plasmid (pSB3K3).
The Measurement Instructions describe a method for measuring the activity of a test promoter relative to the reference standard promoter (BBa_J23101) so that a user of the measurement kit can report the activity of their test promoter in Standard Promoter Units (SPUs). The Registry of Standard Biological Parts includes the SPU calculator to convert the raw fluorescence and OD data into SPUs.
Equipment
Measurement phase
- Spectrophotometer
- Fluorimeter
- 96 well plates
Reagents
Assembly phase
- Miniprep reagents
- Ligation reagents
- Transformation reagents
Measurement phase
- M9 medium
Protocol
Other Protocols Needed
- Miniprep
- Ligation
- Transformation
Assembly Instructions
1. Prepare the test promoter by miniprep of colonies containing promoter test construct followed by restriction digest with Xbal and PstI.(see miniprep protocol)
2. Prepare the GFP reporter device (BBa_E0240) by miniprep of miniprep of colonies containing E0240 followed by restriction digest with Xbal and PstI.
3. Prepare backbone plasmid (pSB3K3) by preparative PCR of pSB3K3-P1010 using primers BBa_G1000 and BBa_G1001 followed by restriction digest with EcoRI and PstI.
4. Combine the test promoter, GFP reporter device, and backbone plasmid in a 3-way ligation to build the promoter test construct. (see ligation protocol)
5. Transform the promoter test construct into TOP10 cells. Select for transformants on Kanamycin plates. Optimum DNA for each component could be approximately 10ng per microlitre.(see transformation protocol)
6. Measure the activity of the test promoter using the measurement instructions.
Promoter Measurement Protocol
Note: The steps below should be repeated for each promoter we wish to characterise.
Note: Needs to be streamlined for 28°C
1. Single colonies of E. coli cells containing the promoter test construct on the vector backbone were inoculated into three 17 mm test tubes containing 5 ml of pre-warmed
(37°C) supplemented M9 medium with kanamycin (20 ug/ml).
2. Cultures were grown in 17 mm test tubes for approximately 20 hrs at 37°C with spinning at 70 rpm.
3. We then diluted the cultures 1:100 into 5 ml of pre-warmed fresh media and the cultures were grown for approximately 4 hours under the previous conditions (17 mm tubes, 37°C, spinning at 70 rpm).
Extra tubes can be used at different temperatures to test the effect of temperature (see effect of temperature assay)
4. After 4 hours, we measured the OD600 of a 500 ul aliquot from each culture on a WPA Biowave Spectrophotometer. This will tell you how many cells you have.
5. Based on this OD measurement, the cultures were diluted to the same OD (0.07) in 5 ml of pre-warmed fresh media and grown for one hour at 37°C. Here we try to make sure everything is at the same OD.
6. We then transferred three 200 ul aliquots from each culture into a flat-bottomed 96 well plate (Cellstar Uclear bottom, Greiner). For ease of measurement.
7. We incubated the plate in a multi-well fluorimeter (Perkin Elmer) at 37°C and assayed with an automatically repeating protocol of absorbance measurements (600 nm absorbance filter, 0.1 second counting time through 5 mm of fluid), fluorescence measurements (485 nm excitation filter, 525 nm emission filter, 0.1 seconds, CW lamp energy 12901 units), and shaking (3 mm, linear, normal speed, 15 seconds). (Just measures GFP – fluorescence over time).
8. Background absorbance was determined by measuring wells containing only media. This should be subtracted from subsequent absorbance readings.(Blank).
9. Background fluorescence was determined at different ODs from the fluorescence of control cells without a GFP expressing vector. (Control)
10. Measurements were taken from an approximately 30 min period in mid-exponential growth.


