Uploads by Angela C Abarquez
From OpenWetWare
Jump to navigationJump to search
This special page shows all uploaded files.
| Date | Name | Thumbnail | Size | Description |
|---|---|---|---|---|
| 15:00, 9 May 2019 | Biomathmatical Modeling Final Presentation .pdf (file) | 670 KB | ||
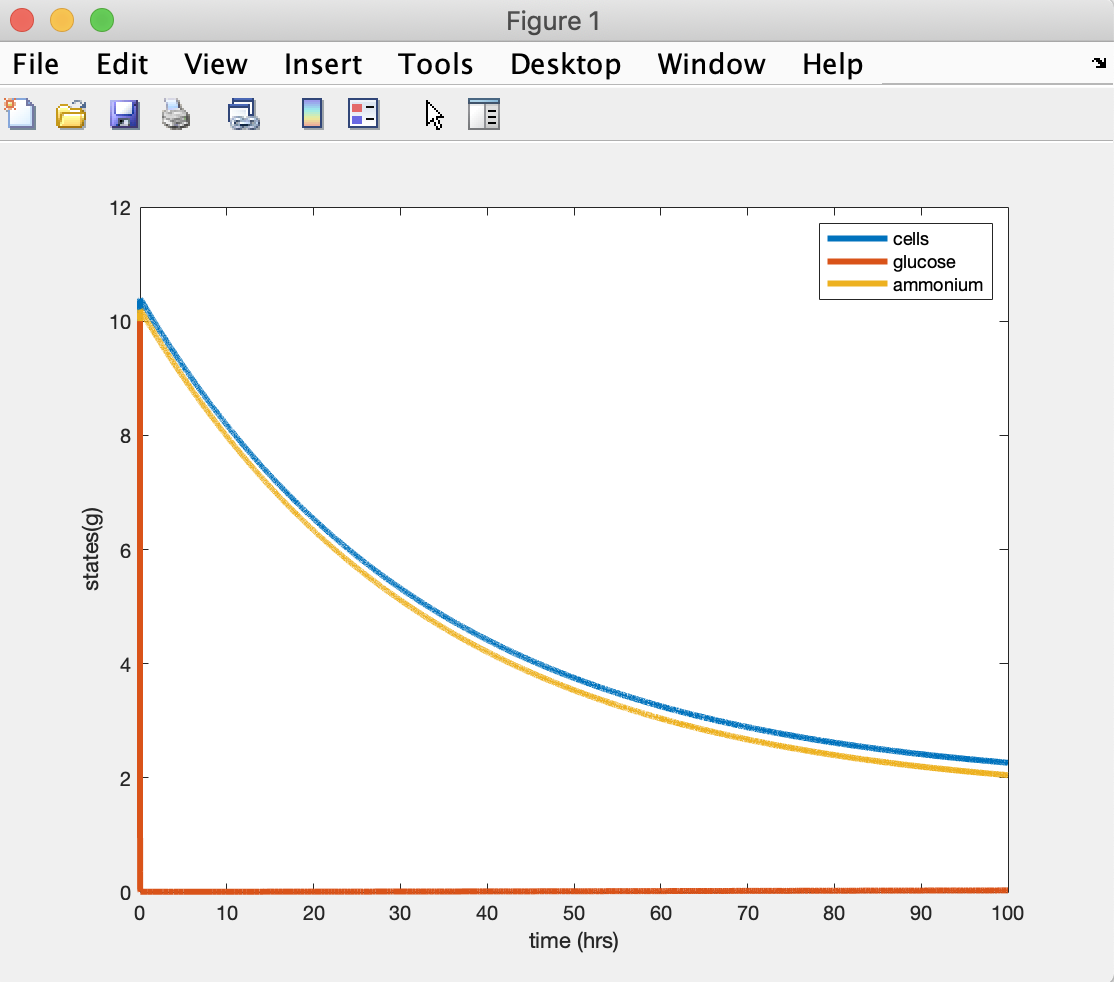
| 02:39, 9 May 2019 | Screen Shot 2019-05-08 at 7.38.49 PM.png (file) |  |
278 KB | add part 1 pic |
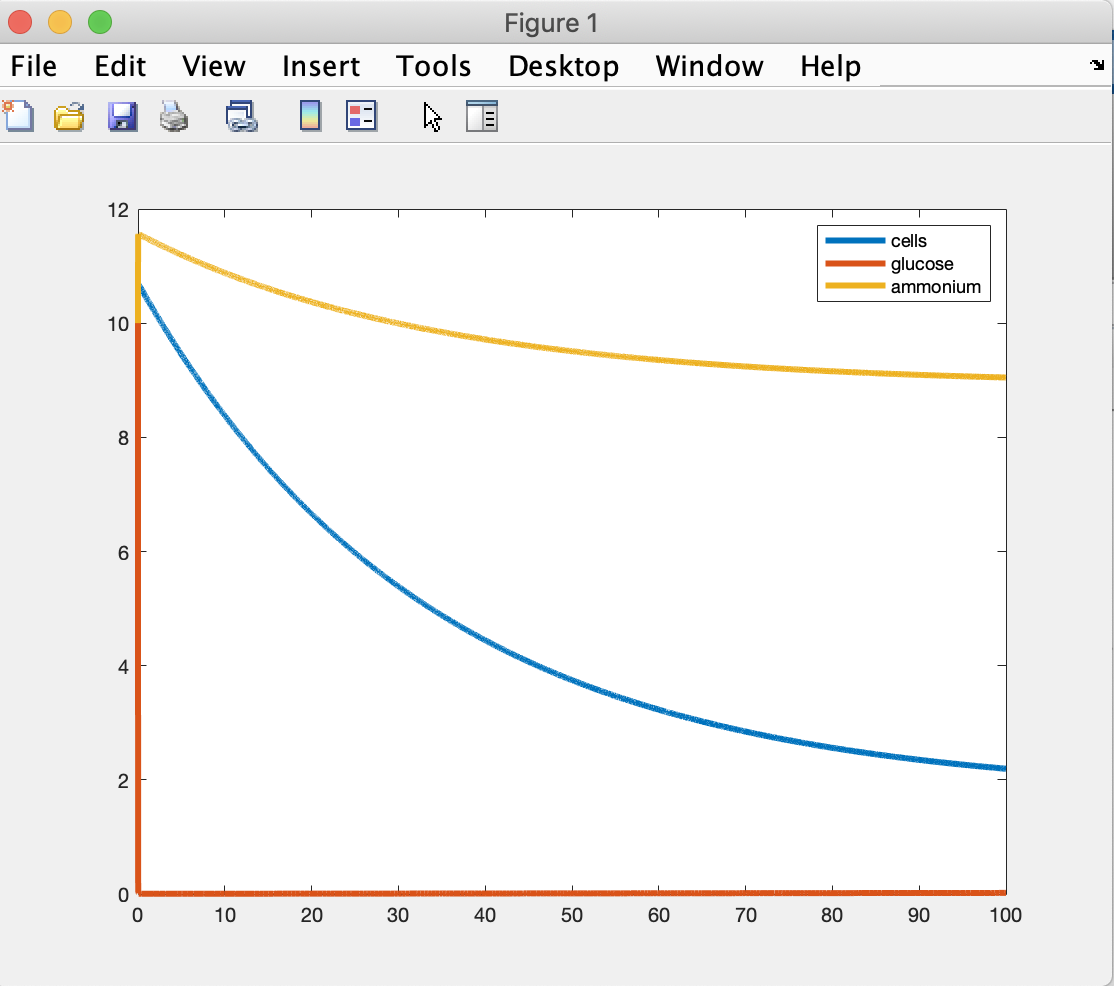
| 02:35, 9 May 2019 | Slide1.png (file) |  |
55 KB | added part 2 |
| 02:32, 9 May 2019 | Presentation1final.pdf (file) | 370 KB | part 2 | |
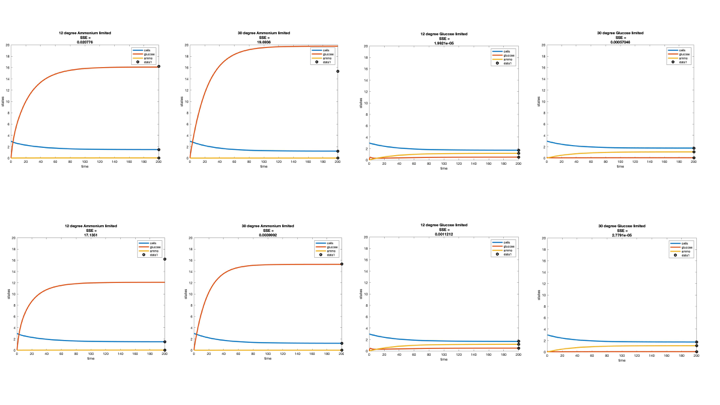
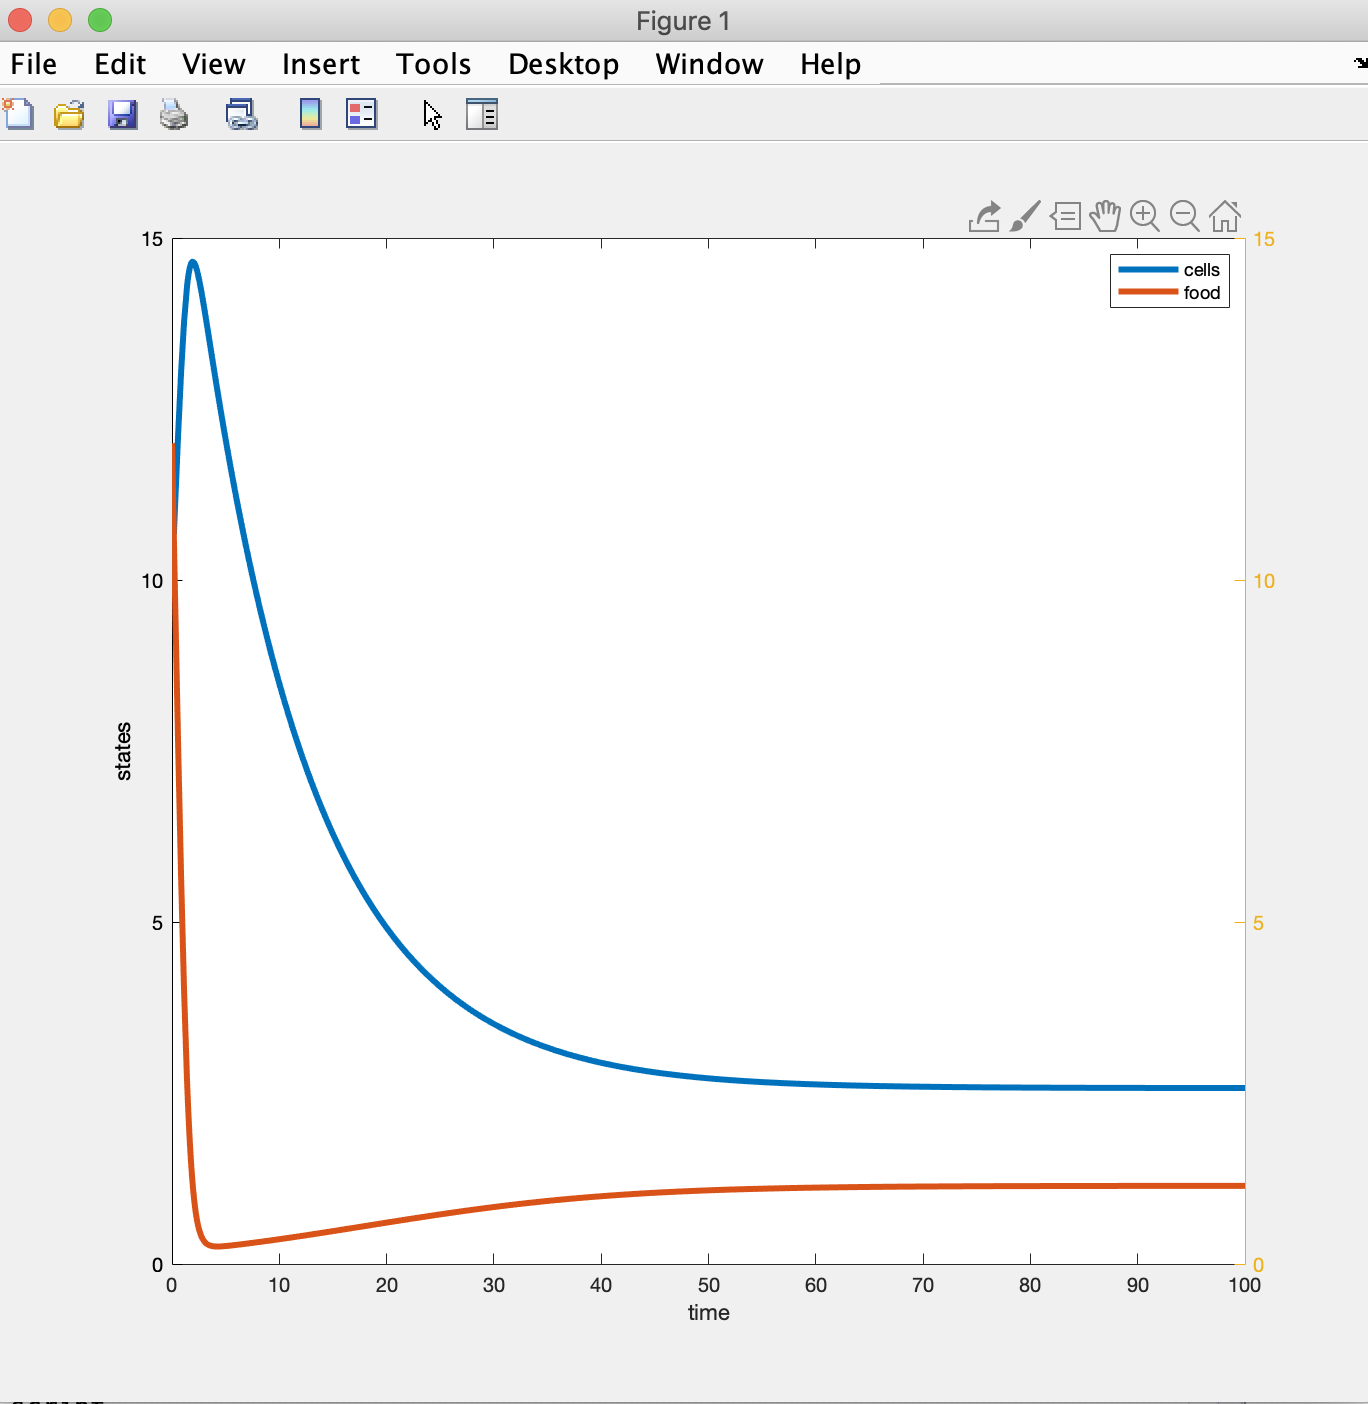
| 06:36, 26 April 2019 | Screen Shot 2019-04-25 at 11.28.55 PM.png (file) |  |
111 KB | n lim pic |
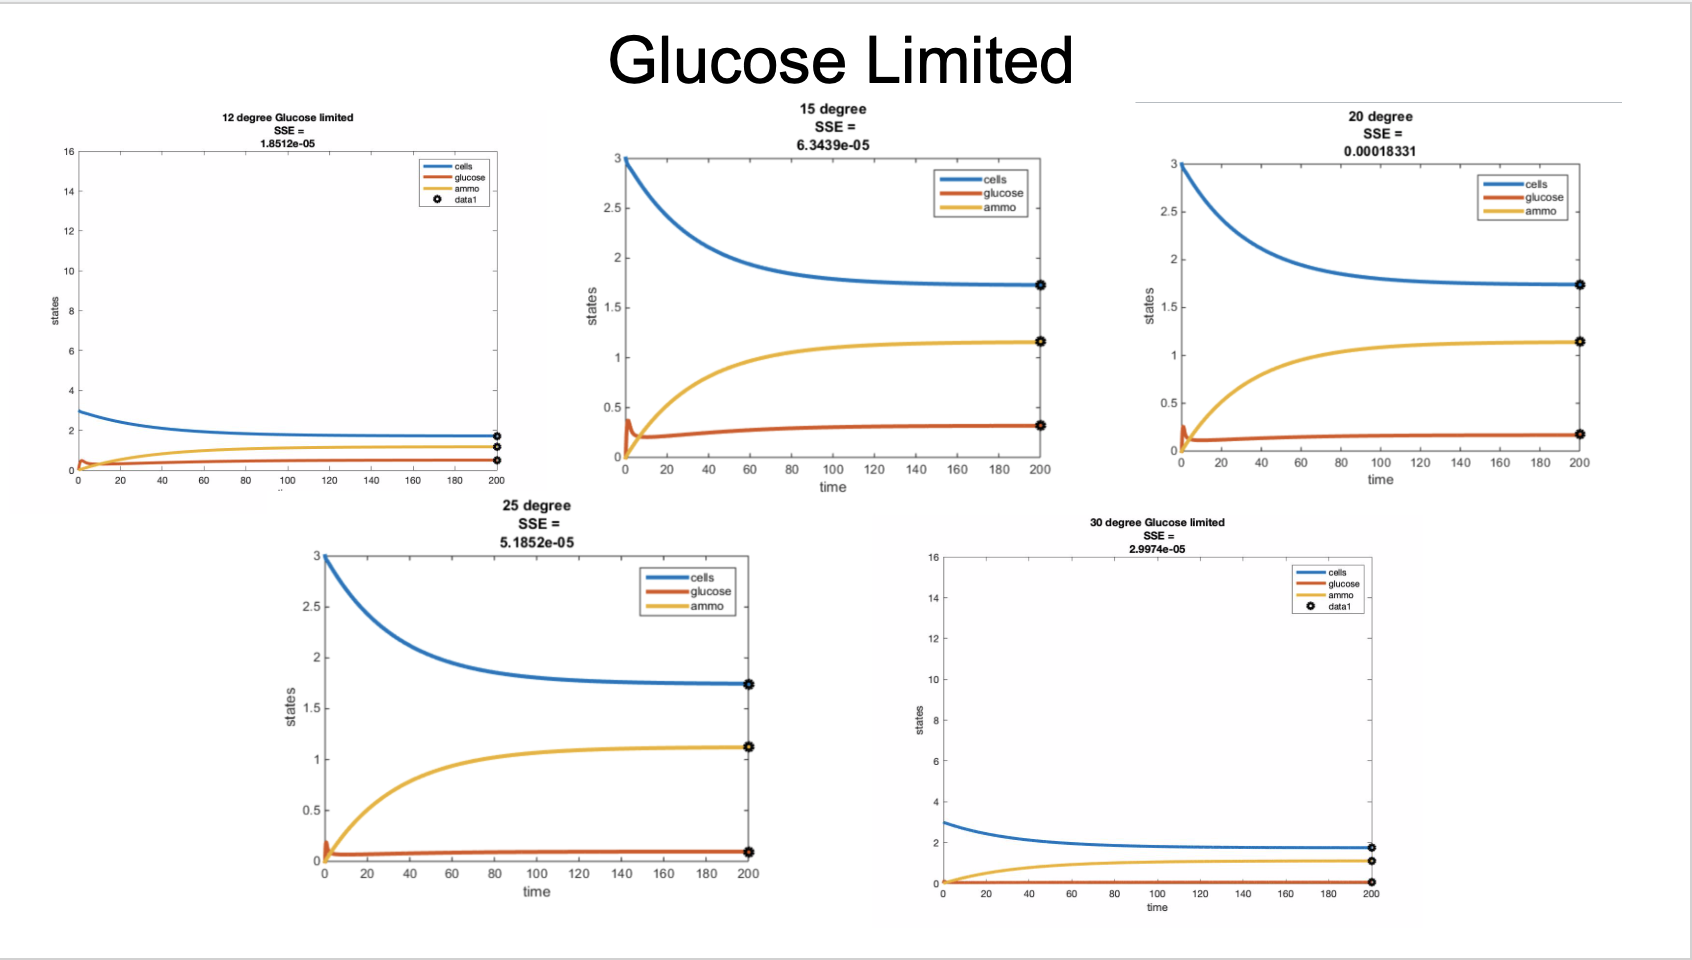
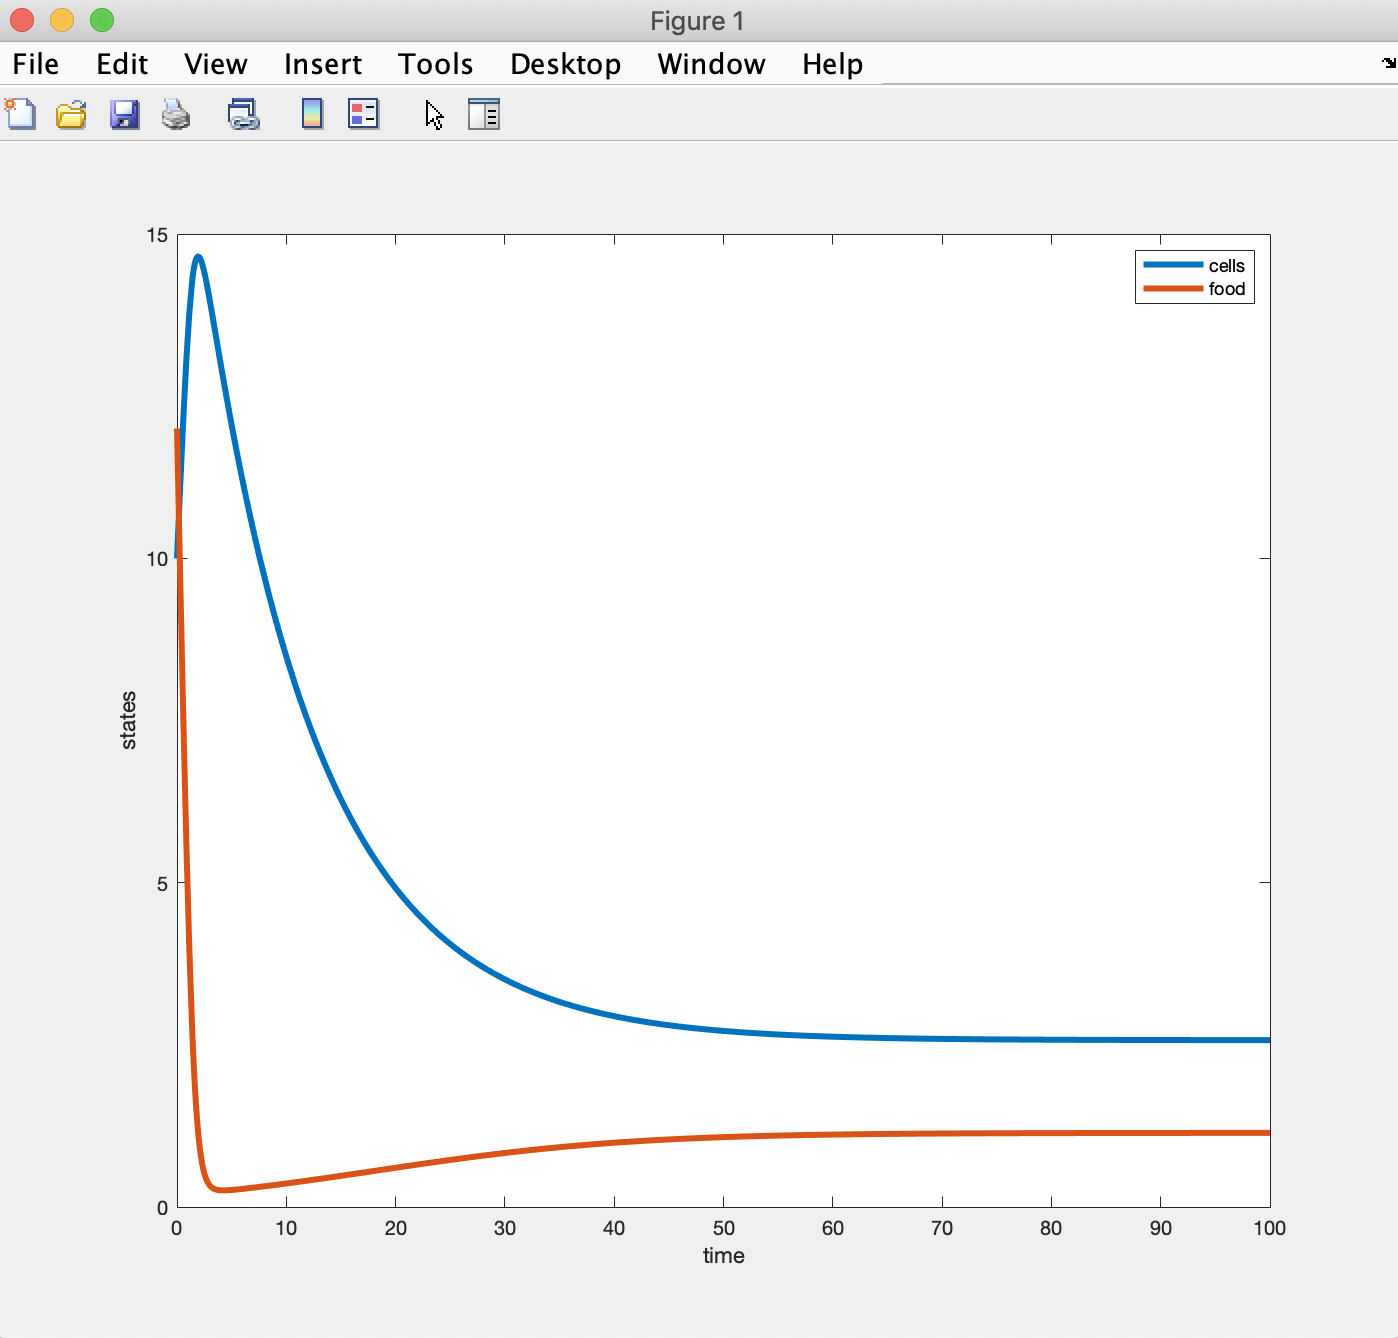
| 06:34, 26 April 2019 | Screen Shot 2019-04-25 at 11.18.09 PM.png (file) |  |
105 KB | added c lim pic |
| 06:32, 26 April 2019 | AA chemostat 2nutrient script Nlim.pdf (file) | 31 KB | n lim script | |
| 06:31, 26 April 2019 | AA chemostat 2nutrient script Clim.pdf (file) | 31 KB | clim script | |
| 23:52, 23 April 2019 | AA chemostat 2nutrient script.m.zip (file) | 1 KB | script MATLAB file | |
| 23:49, 23 April 2019 | AA chemostat 2nutrient dynamics.m.zip (file) | 1 KB | Matlab dynamics file | |
| 03:22, 11 April 2019 | Abarquez Week 11 chemostat script.m.zip (file) | 1 KB | chemostat script | |
| 03:17, 11 April 2019 | Screen Shot 2019-04-10 at 8.16.32 PM.png (file) |  |
118 KB | bonus graph |
| 01:33, 11 April 2019 | Screen Shot 2019-04-10 at 5.47.26 PM.png (file) |  |
109 KB | Matlab graph 4/10 |
| 23:20, 3 April 2019 | AbarquezWeek10.zip (file) | 3 KB | Week 10 files | |
| 02:04, 7 March 2019 | NewScreen Shot 2019-03-06 at 5.53.11 PM.png (file) |  |
37 KB | updated threshold graph |
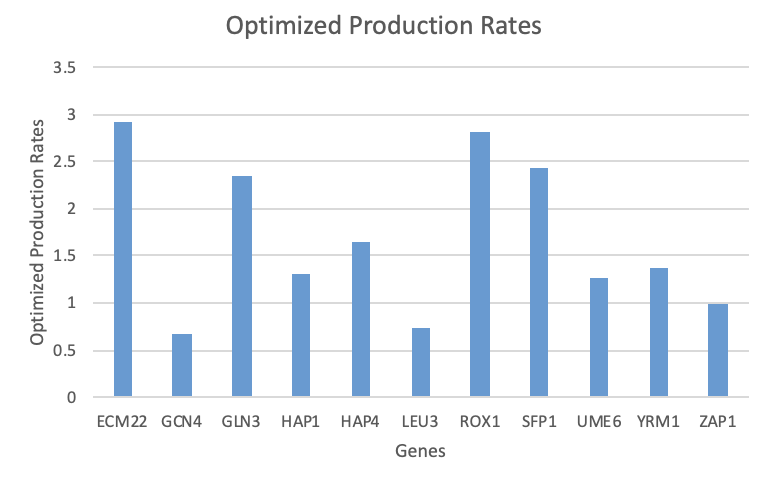
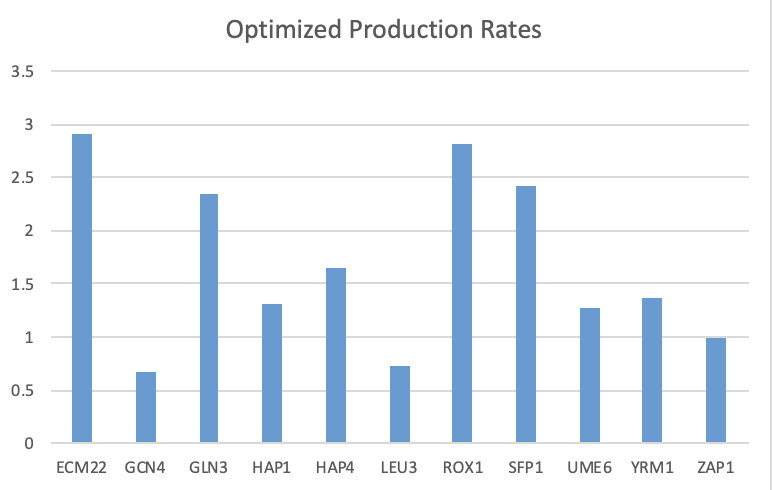
| 01:55, 7 March 2019 | Screen Shot 2019-03-06 at 5.53.58 PM.png (file) |  |
44 KB | production rates graph |
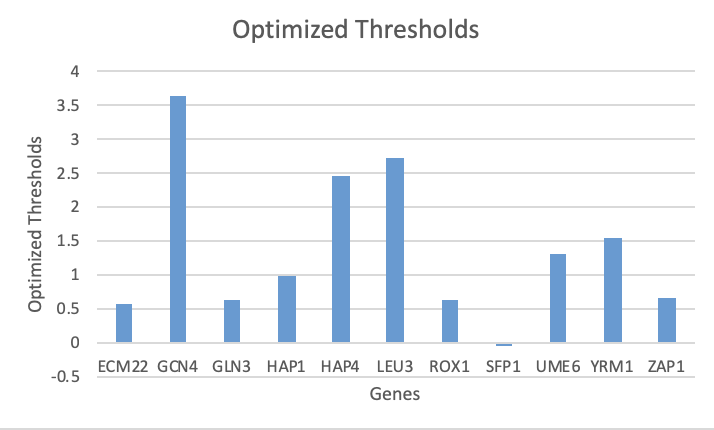
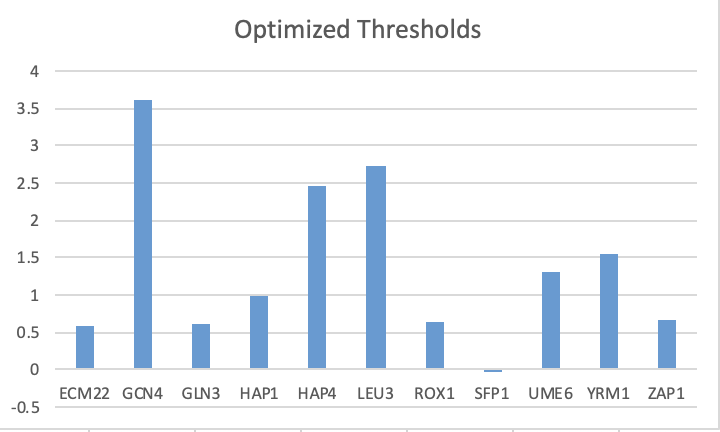
| 01:26, 7 March 2019 | Screen Shot 2019-03-06 at 5.22.27 PM.png (file) |  |
32 KB | optimized thresholds |
| 01:25, 7 March 2019 | Screen Shot 2019-03-06 at 5.21.39 PM.png (file) |  |
35 KB | production rates graph |
| 01:10, 7 March 2019 | Screen Shot 2019-03-06 at 5.07.21 PM.png (file) | 127 KB | data table | |
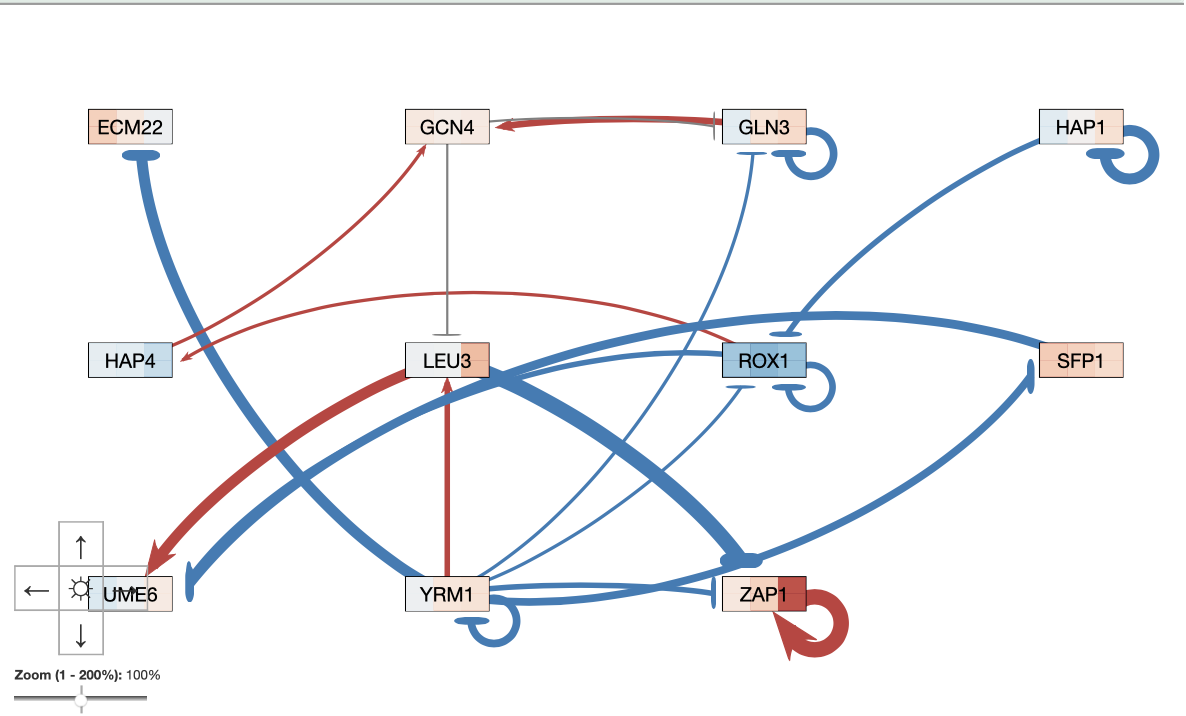
| 01:09, 7 March 2019 | Screen Shot 2019-03-06 at 5.05.05 PM.png (file) |  |
129 KB | GRNsight map |
| 18:43, 5 March 2019 | GRNsight Actualvs.Simulated .PNG (file) |  |
84 KB | added grnsight figure |
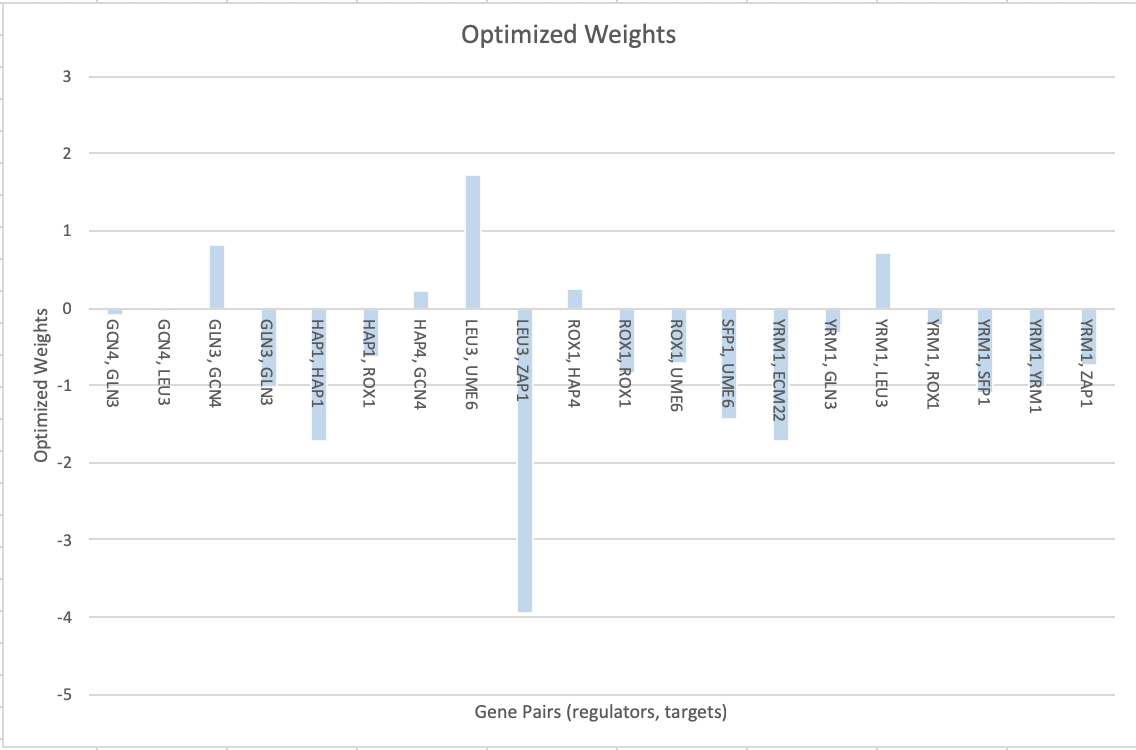
| 14:22, 4 March 2019 | Optimized weights graph.png (file) |  |
77 KB | optimized weights graph |
| 18:44, 19 February 2019 | Wt profile GOlists.zip (file) | 54 KB | Profile GO lists folder | |
| 18:34, 19 February 2019 | Wt profile genelists.zip (file) | 23 KB | test of genelist zip file | |
| 20:28, 13 February 2019 | BIOL388 S19 p-value slide AA.pdf (file) | 34 KB | link to powerpoint | |
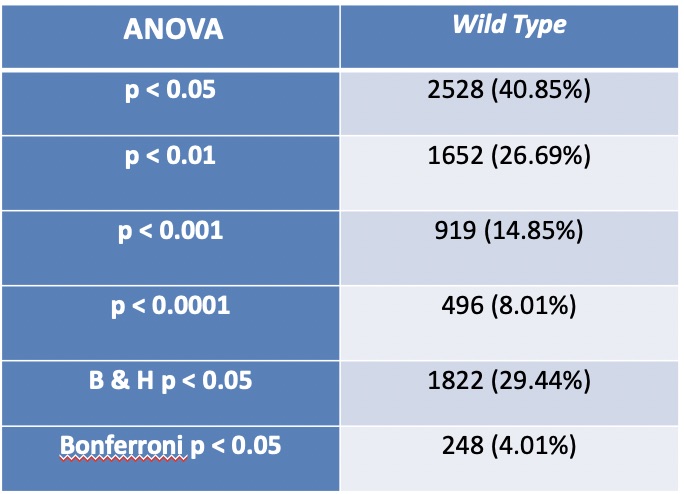
| 20:25, 13 February 2019 | Wild Type P-Values.jpeg (file) |  |
69 KB | P-Value table for wild type |
| 20:21, 13 February 2019 | Wild Type P-Value Table.pdf (file) | 34 KB | P-value table | |
| 19:43, 30 January 2019 | Q1Graph.png (file) |  |
50 KB | upload Q1 graph |
| 06:59, 24 January 2019 | AbarquezScienceResume12-27-18.pdf (file) | 129 KB | abarquez resume | |
| 06:49, 24 January 2019 | 0.jpeg (file) |  |
13 KB | added prof pic |
