Uploads by Nkokkula
From OpenWetWare
Jump to navigationJump to search
This special page shows all uploaded files.
| Date | Name | Thumbnail | Size | Description |
|---|---|---|---|---|
| 13:08, 30 April 2024 | Pulsatile blood sim.jpg (file) |  |
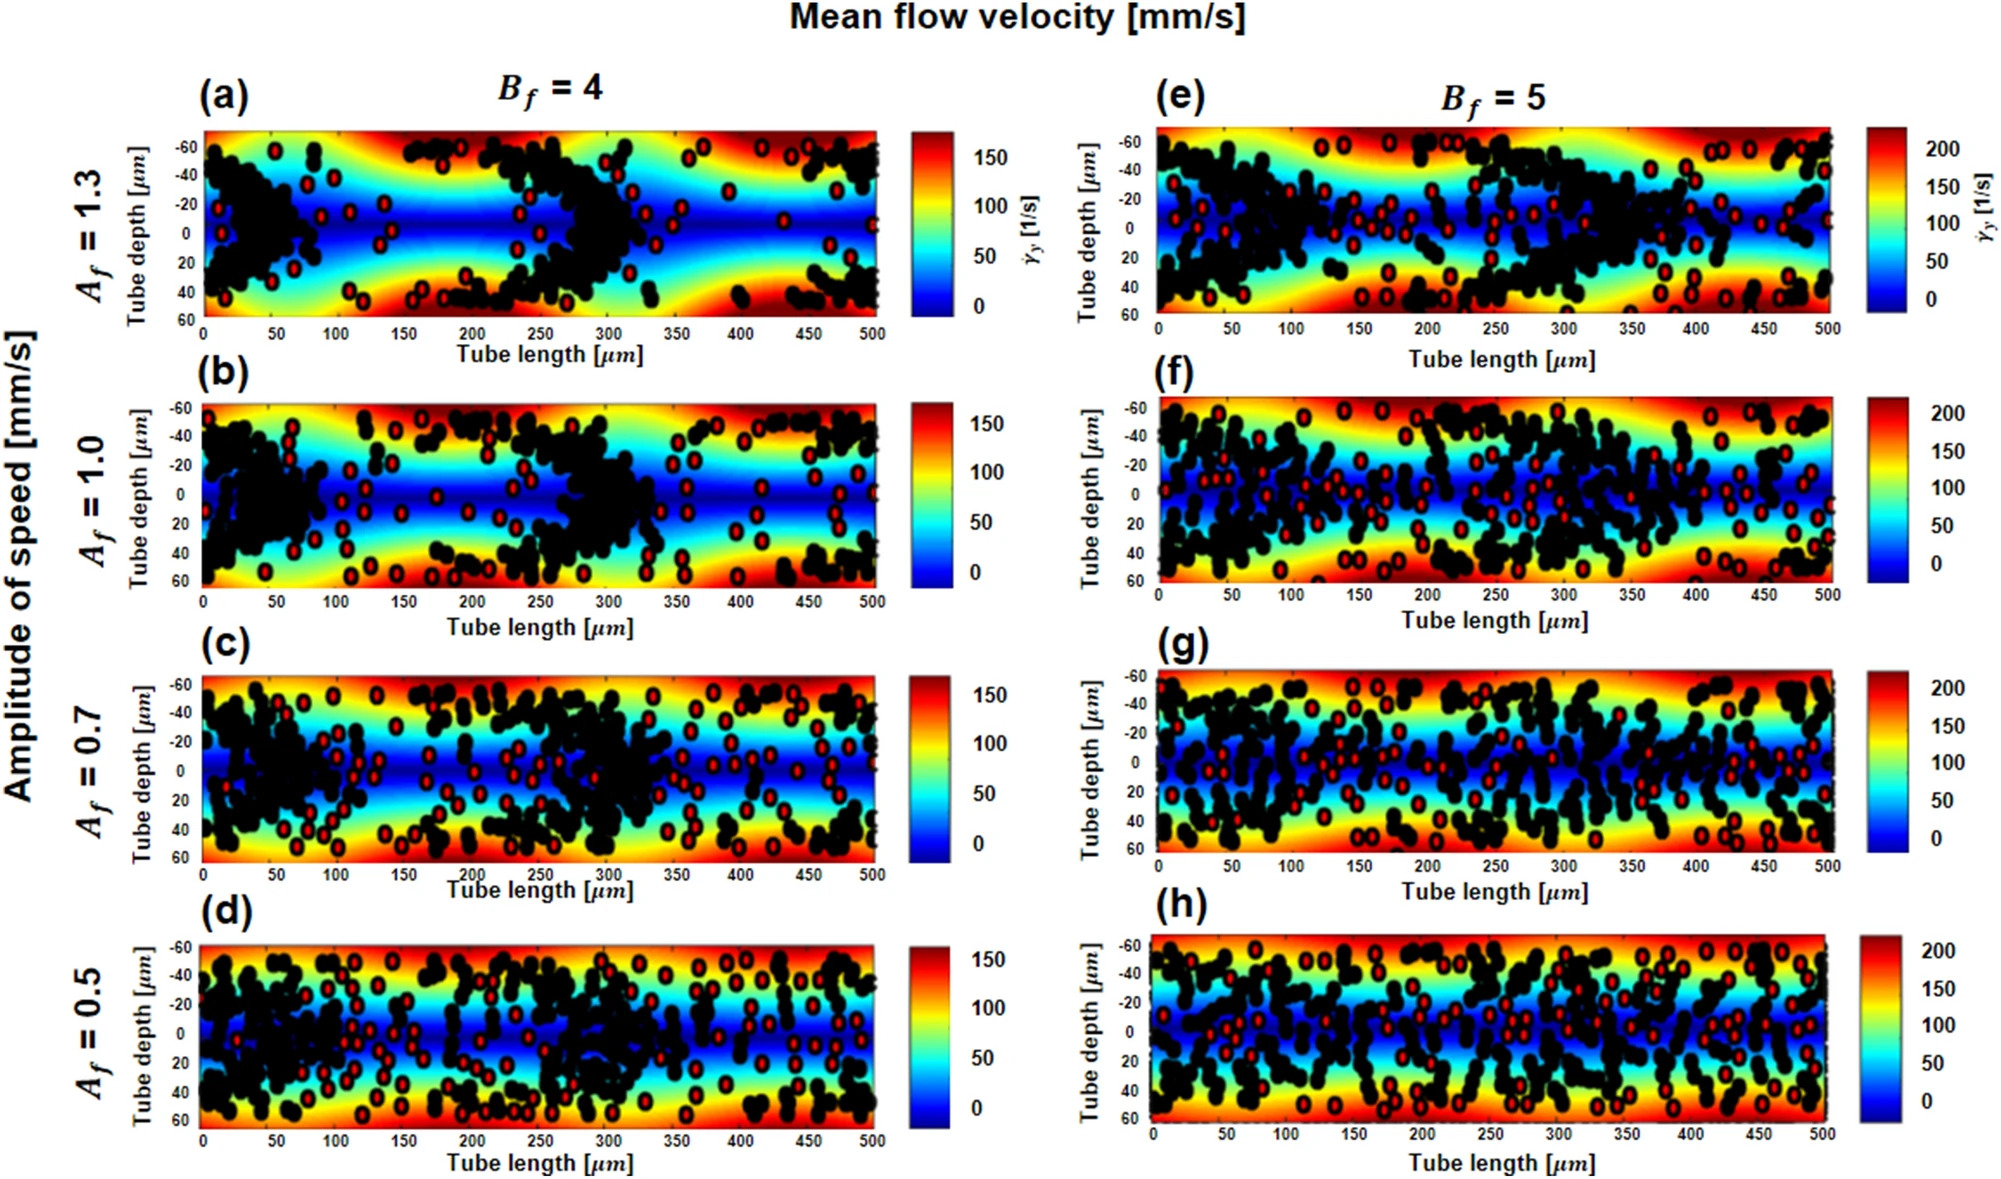
670 KB | Numerically simulated formation of RBC rouleaux under pulsatile flow at 0.96s. The black and red particles represent aggregated and nonaggregated RBCs, respectively. The color gradient is the shear rate in the flow (1/s). (a)-(d) are RBC distributions at velocity amplitudes from 0.5 mm/s to 1.3 mm/s at a mean flow velocity of 4 mm/s. (e)-(h) are RBC distributions at the same velocity amplitudes at a mean flow velocity of 5 mm/s. Lee, C.-A.; Paeng, D.-G. Numerical Simulation of Spatiotemporal... |
| 13:04, 30 April 2024 | Pulsatile blood sim.webp (file) |  |
339 KB | Numerically simulated formation of RBC rouleaux under pulsatile flow at 0.96s. The black and red particles represent aggregated and nonaggregated RBCs, respectively. The color gradient is the shear rate in the flow (1/s). (a)-(d) are RBC distributions at velocity amplitudes from 0.5 mm/s to 1.3 mm/s at a mean flow velocity of 4 mm/s. (e)-(h) are RBC distributions at the same velocity amplitudes at a mean flow velocity of 5 mm/s. Lee, C.-A.; Paeng, D.-G. Numerical Simulation of Spatiotemporal... |
| 12:54, 30 April 2024 | CFL in vitro.png (file) |  |
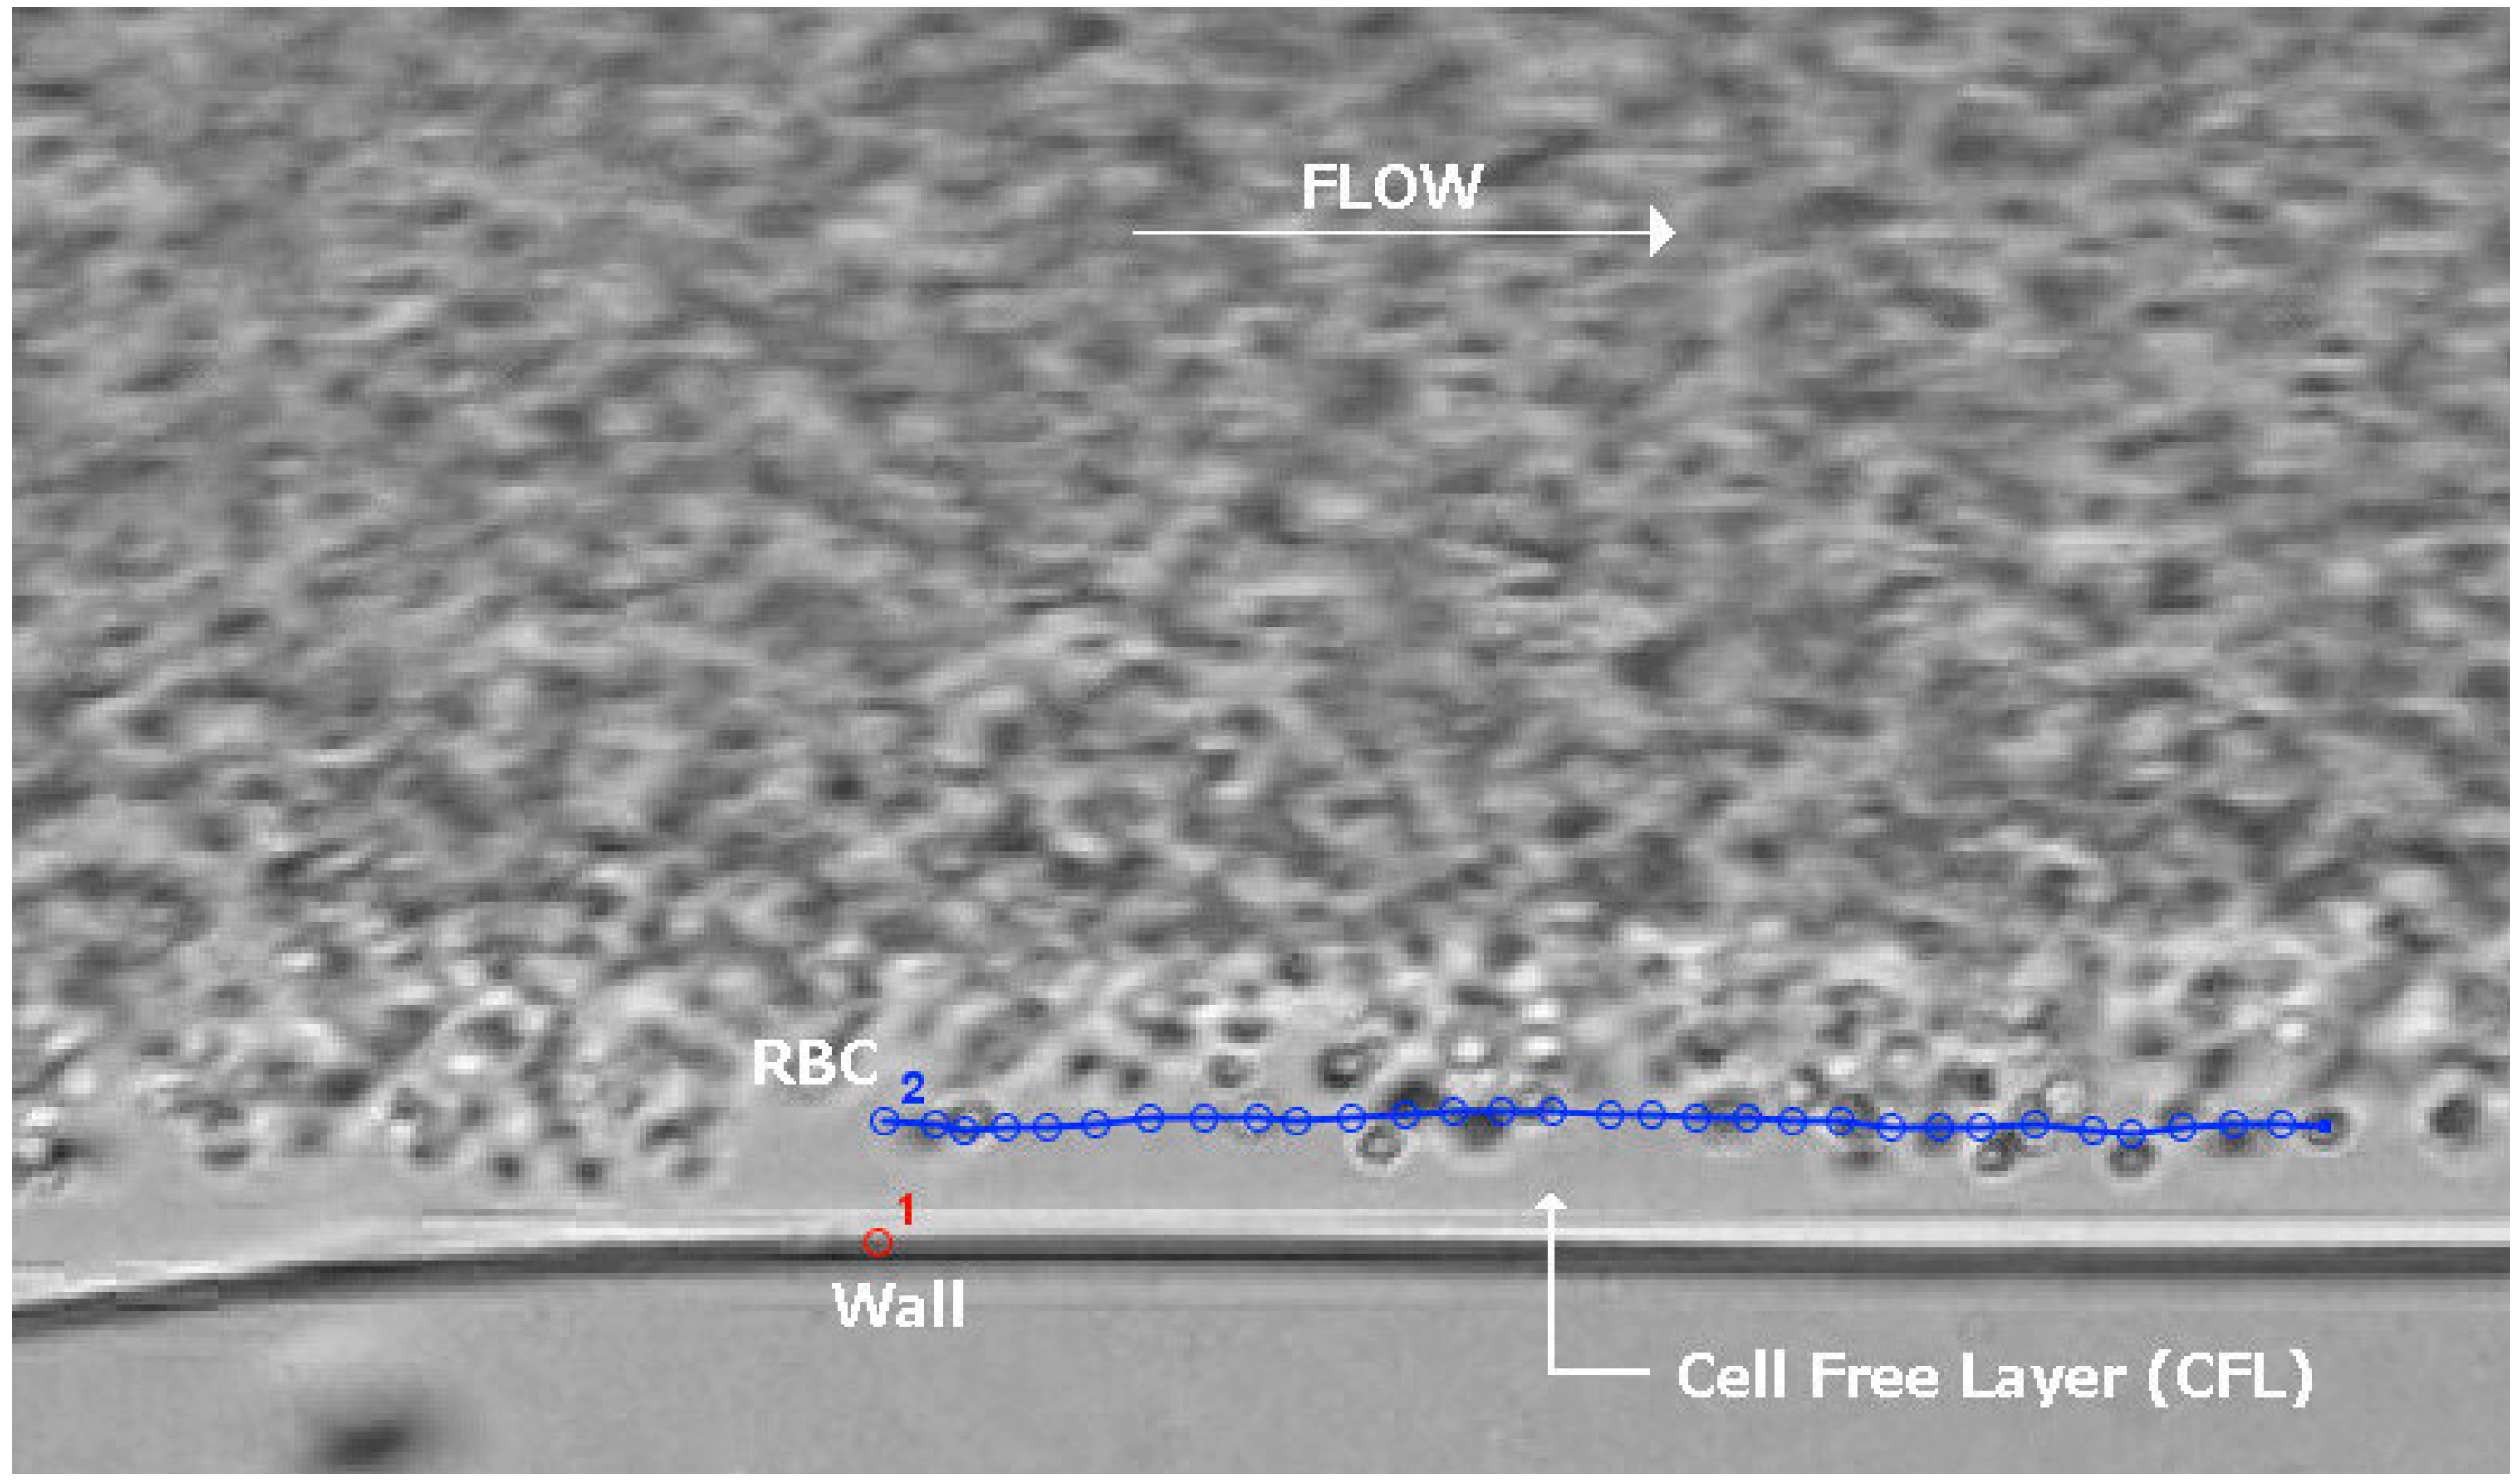
808 KB | RBCs flow through a PDMS microfluidic channel and form an RBC-FL. The blue line tracks a single RBC across frames. The image was created by overlaying frames of a captured video. Pinto, E.; Faustino, V.; Rodrigues, R. O.; Pinho, D.; Garcia, V.; Miranda, J. M.; Lima, R. A Rapid and Low-Cost Nonlithographic Method to Fabricate Biomedical Microdevices for Blood Flow Analysis. Micromachines 2015, 6 (1), 121–135. https://doi.org/10.3390/mi6010121. is licensed under CC BY 4.0 |
| 12:40, 30 April 2024 | Blood particle distribution.jpg (file) |  |
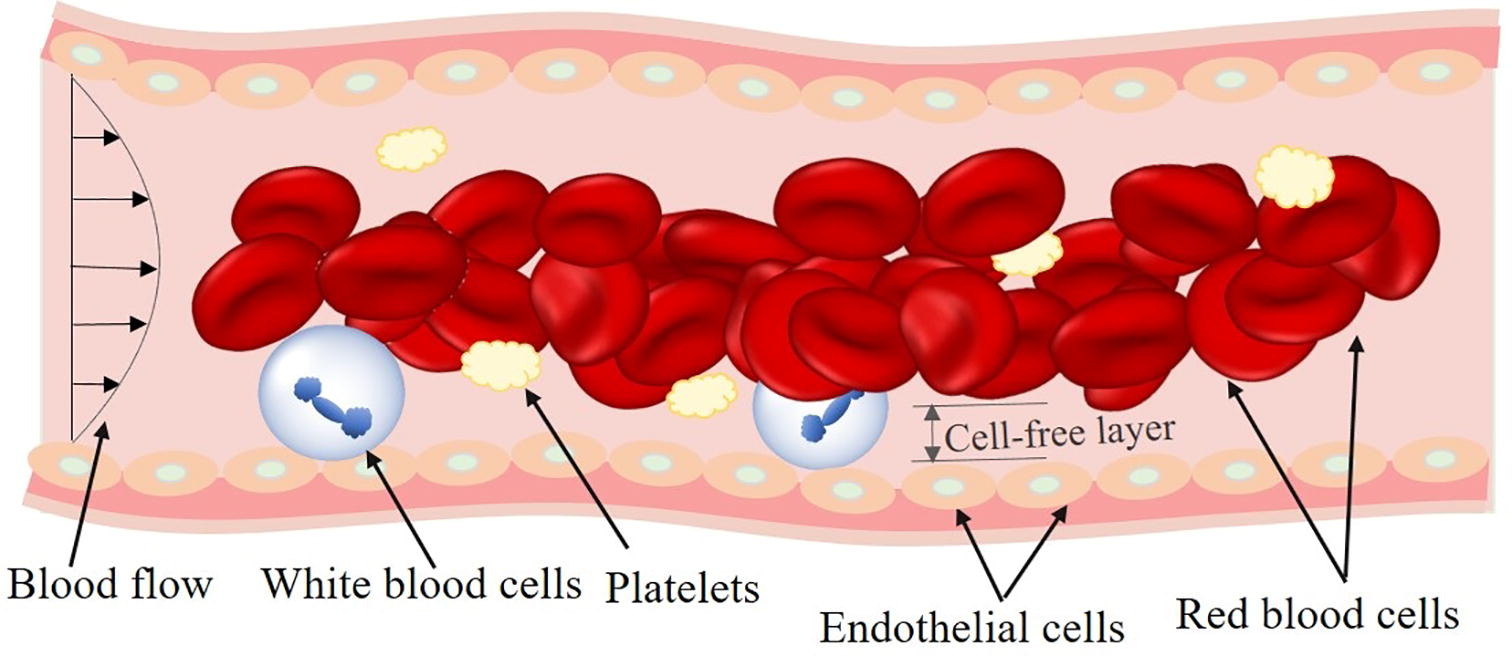
124 KB | Representation of the distribution of WBCs, RBCs, and platelets in a blood vessel. The parabolic laminar velocity distribution is shown at the left end of the vessel. Wang, S.; Han, K.; Ma, S.; Qi, X.; Guo, L.; Li, X. Blood Cells as Supercarrier Systems for Advanced Drug Delivery. Med. Drug Discov. 2022, 13, 100119. https://doi.org/10.1016/j.medidd.2021.100119. is licensed under CC BY-NC-ND 4.04 |
| 01:48, 15 April 2024 | MarginationSize.jpeg (file) |  |
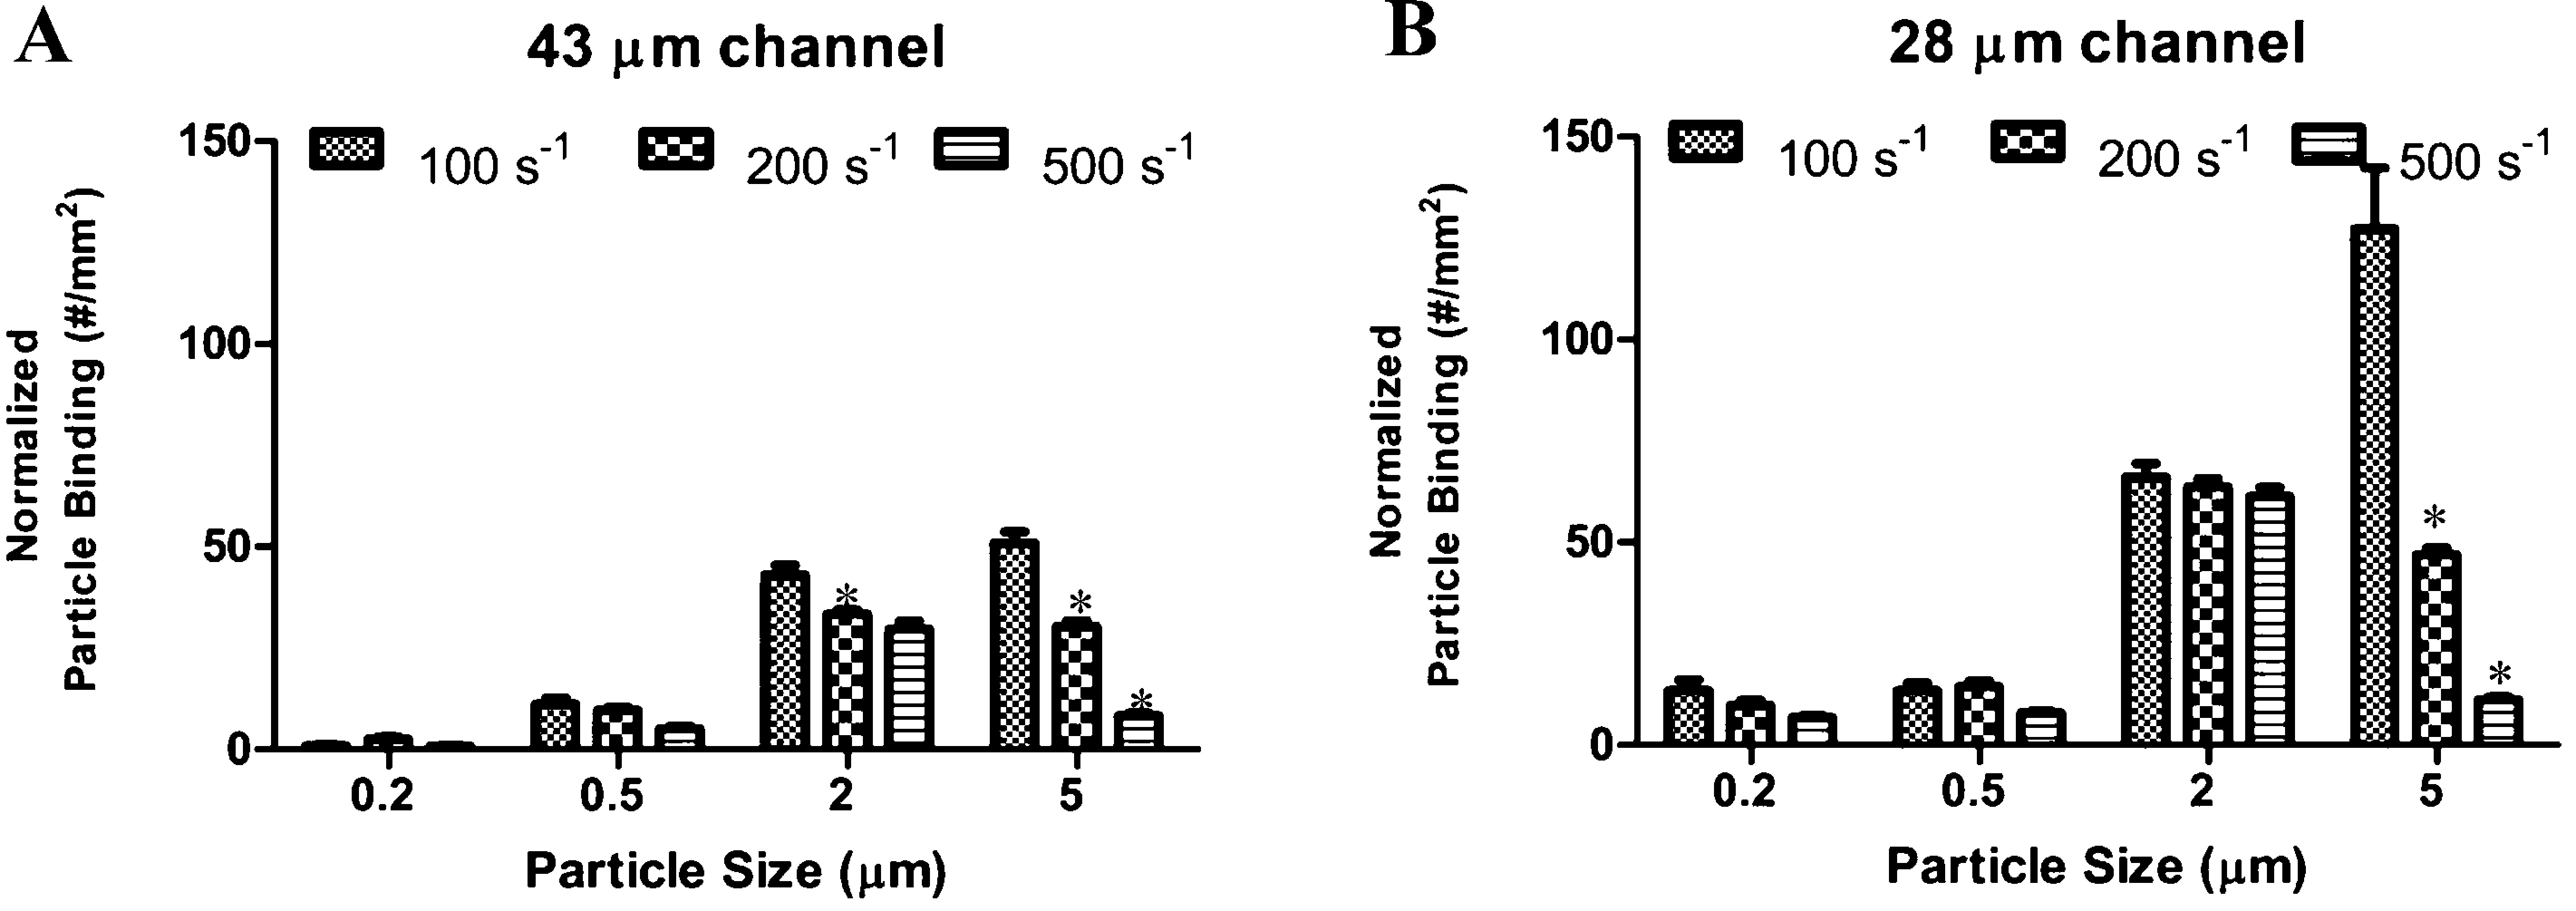
424 KB | Reprinted with permission from Namdee, K.; Thompson, A. J.; Charoenphol, P.; Eniola-Adefeso, O. Margination Propensity of Vascular-Targeted Spheres from Blood Flow in a Microfluidic Model of Human Microvessels. Langmuir 2013, 29 (8), 2530–2535. https://doi.org/10.1021/la304746p. Copyright 2013 American Chemical Society. |
| 01:25, 11 March 2024 | VSLI image 1.png (file) |  |
250 KB | Updated with available source |
