Talk:20.109(S08):Induce protein expression (Day4)
From OpenWetWare
Jump to navigationJump to search

TR O/N cultures
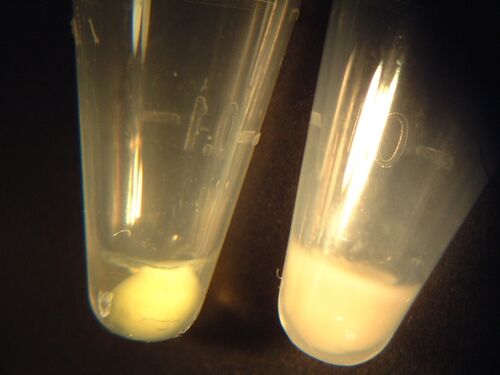
The table below lists the OD600 values of 1:10 dilutions of the cultures grown overnight, as well as the pellet observations.
Group red: the -IPTG value for your W2 sample was 0.0537.
| Group | OD WT | OD Mut1 | OD Mut2 | Pellets yellow? |
|---|---|---|---|---|
| Green | 0.118 | 0.070 D1 | 0.072 H1 | Y, but D1 weak |
| Purple | 0.123 | 0.087 K1 | 0.085 E2 | Y |
| Blue | 0.104 | 0.111 D2 | 0.047 P2 | Y |
| Red | 0.131 | 0.085 R2 | 0.068 W2 | Y |
WF O/N cultures
The table below lists the OD600 values of 1:10 dilutions of the cultures grown overnight, as well as the pellet observations.
| Group | OD WT | OD Mut1 | OD Mut2 | Pellets yellow? |
|---|---|---|---|---|
| Green | 0.063 | 0.087 H2 | 0.076 A2 | Y |
| Purple | 0.073 | 0.093 L1 | 0.088 T2 | Y |
| Yellow | 0.075 | 0.077 K1 | 0.077 E3 | Y |
| Red | 0.078 | 0.084 P2 | 0.080 W1 | Y |
| Pink | 0.072 | 0.310 P1 | 0.067 R2 | WT-Y, Mut-N or v. weak |