User:Alexander T. J. Barron/Notebook/PHYC 307L Lab Notebook/balmerseries notes
SJK Incomplete Feedback Notice

My feedback is incomplete on this page for two reasons. First, the value of the feedback to the students is low, given that the course is over. Second, I'm running out of time to finish grading!
SJK 18:58, 18 December 2008 (EST)
I may have a comment or two on Justin's page
SJK 19:14, 18 December 2008 (EST)
I do see the left versus right study, but what I don't see is mention that you accounted for backlash when taking your data?
Apparatus
...can be found in Dr. Gold's manual.
Spectrometer Calibration
Inserting the mercury lamp we began our calibration.
Adjusting the wavelength to 546.1 nm, then rotating the prism, we saw our green light and put it smack dab in the center of our crosshairs. Rotating the screw drive to 435.8 for violet, we saw the violet light in our cross hairs, validating our calibration.
We noticed that this calibration works well for smaller wavelengths, but deviates a little bit by the time we get to the red part of the spectrum.
Data
Hydrogen
We had to switch out the gas tube because we were not seeing all the lines at first. The second gas tube was a bit more intense, and it enabled us to see more lines.
1st Run:
- violet 435.2 nm
- cyan 488.0 nm
- yellow 586.0 nm
- red 664.2 nm
2nd Run:
- violet 434.6 nm
- cyan 487.8 nm
- yellow 586.0 nm
- red 664.0 nm
Deuterium
1st Run:
- deep violet 409.3 nm
- violet 432.5 nm
- cyan 484.0 nm
- yellow 579.5 nm
- red 653.5 nm
2nd Run:
- deep violet 409.0 nm
- violet 432.8 nm
- cyan 484.3
- yellow 579.1
- red 653.0
Both yellow readings for Hydrogen and Deuterium were somewhat hard to measure. The spectra were unclear, more a collection of yellowish lines without a real serious contender than anything.
Krypton
After checking out Boleszek's labe notebook, we found that Na lamps don't comprise part of the collection currently, so also chose Krypton to check resolving power.
violet lines:
eyeballed closest:
1a: 444 nm
2a: 448 nm
distance a: 4 nm
1b: 434.9 nm
2b: 436.1 nm
distance b: 1.2 nm
Left vs. Right... Right Wins (political joke har har)
to left side of green bar, Krypton...
coming from right: 555.0 nm from left: 554.4 nm
to right side of orange bar, Krypton...
coming from right: 578.0 nm from left: 577.3 nm
to left side of a violet bar, Krypton...
coming from right: 431.1 nm from left: 431.0
It seems like the accuracy of the screw drive gets worse with increased wavelength.
Data Analysis
Colors > Numbers
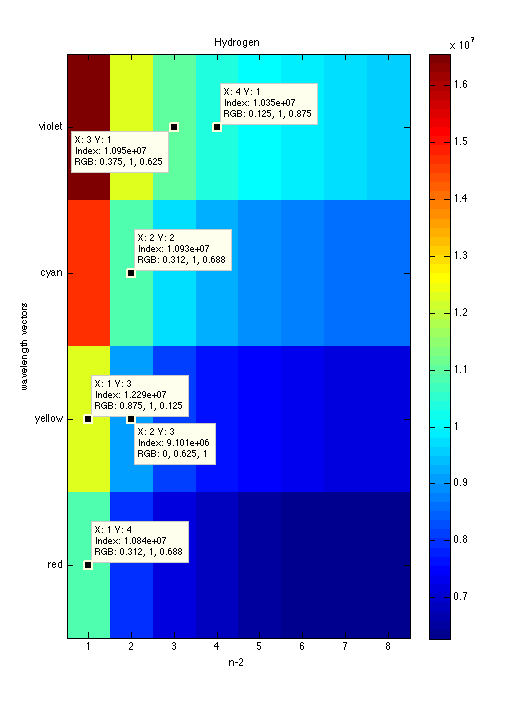
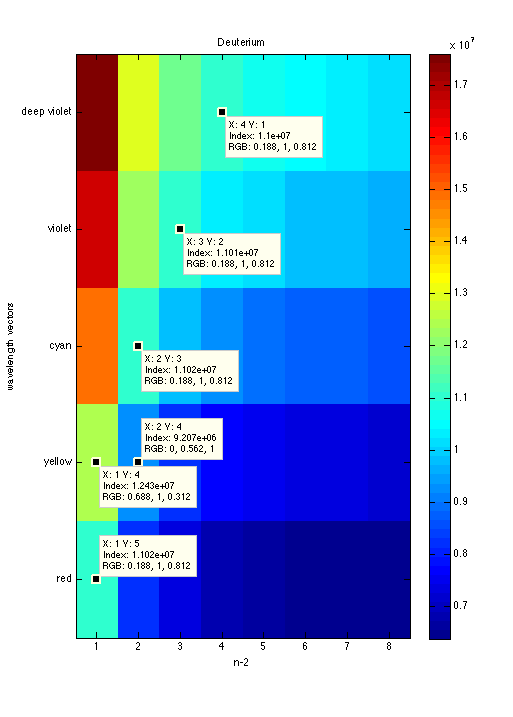
Here I use a handy tool in MATLAB called imagesc(M). It plots matrix M, assigning colors according to numerical value. I've generated values of R for each wavelength measured with n = 3..10. Hopefully I'll get one color in common over all rows:
SJK 19:09, 18 December 2008 (EST)
Oh cool, I think I almost understand what you did here! (Definitely a bit more explanation is warranted.) I am wondering if this kind of graphing procedure would be wicked cool for the millikan experiment (where the number of charges is unknown and must be "guessed").
|
|
Not quite, but nearly. Here are the values of R (denoted by "Index"), n that I used in my analysis:
|
|
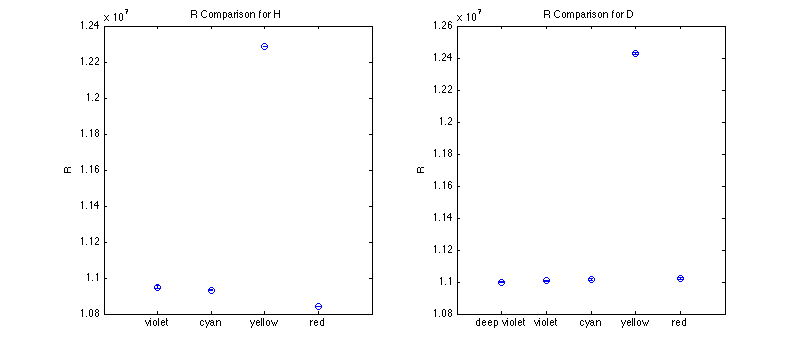
These yellow spectra bother me. If the lamp is generating specific frequencies of visible light due to exact electron energy level transitions from the H atom, how can yellow spectra even exist "between" cyan and red? The latter two both have Rydberg constants which correlate quite nicely from quantum n = 1 & 2. Yellow shouldn't exist, if one looks at this data set. I'm guessing the gas in the lamp might not be completely pure, or perhaps the gas isn't truly monatomic. Emission from diatomic hydrogen might display yellow spectra. I'm strongly tempted to not include yellow spectra data.
Error Method
Since I've gleaned the best values for n for each wavelength, I can plug in my error from λi directly into the Rydberg equation:
[math]\displaystyle{ R_{i up} = \frac{4n^2}{(\lambda_{i} + \sigma_{\lambda i}) \times (n^2-4)} , R_{i low} = \frac{4n^2}{(\lambda_{i} - \sigma_{\lambda i}) \times (n^2-4)} }[/math]
Yeller's My Dawg
All R values are consistent with one another save those for yellow spectra. Remember that the yellow spectra were more a collection of yellowish lines than a clear reading. Here I'll see whether I should can data from those spectra altogether.
SJK 19:05, 18 December 2008 (EST)
I am confused as to how you calculated an R for the yellow? Nevertheless, I'm glad you found it and looked into the issue.
|
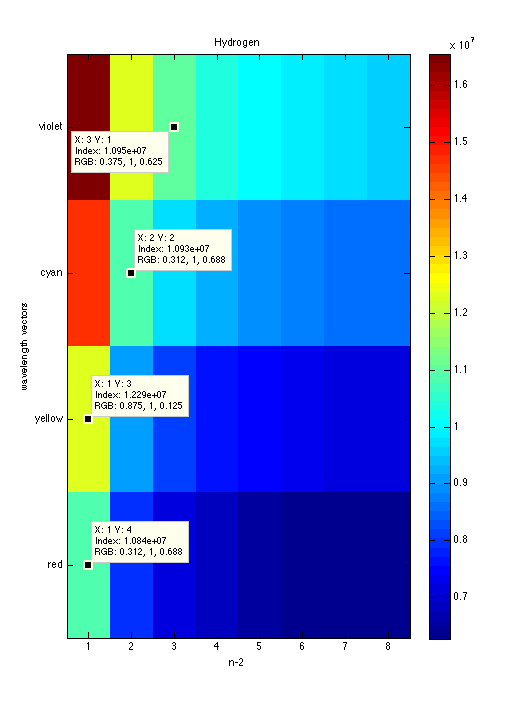
OK, so yeller's waaay off the reservation. It's not an extremum in wavelength in our readings, so systematic error due to calibration isn't likely. Let's see how things look without yellow data.
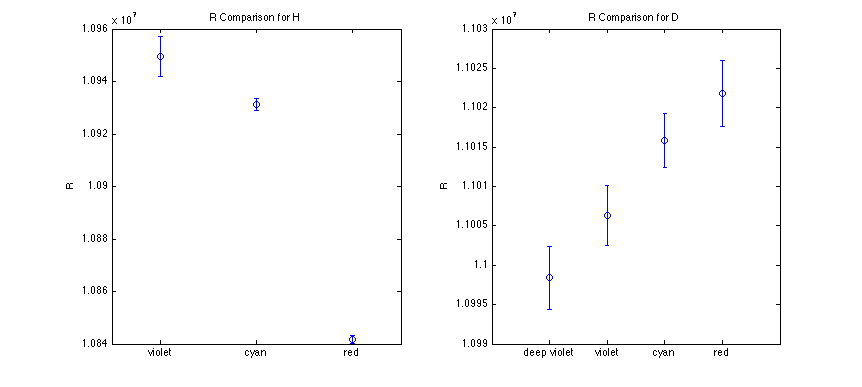
|
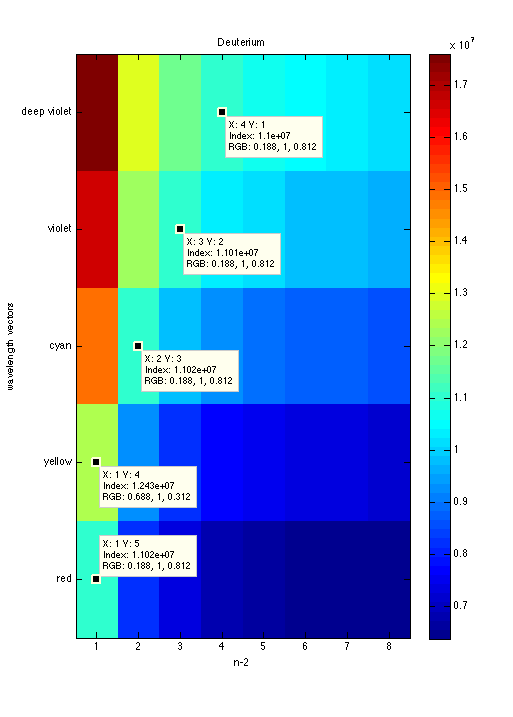
This looks a lot better, but there is a definite trend in R with increased wavelength. The trend is great enough to disallow most overlap of uncertainty, so I don't believe I can compute a weighted average with statistical uncertainty.
I find it odd that the trend propagates in opposite directions between Hydrogen and Deuterium. I don't have a good theory on this, other than it might have something to do with the increased mass in the nucleus for Deuterium. That's a long shot, however, because the Coulomb force would completely dominate.SJK 19:06, 18 December 2008 (EST)
This is intriguing. Did you re-calibrate before Deuterium?
Final Results
SJK 19:07, 18 December 2008 (EST)
I notice that both H and D go away from the accepted value as lambda increases.
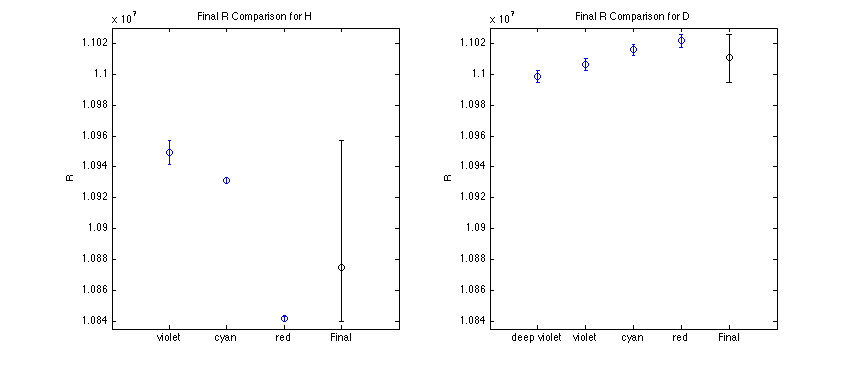
Final R computed as a weighted mean, with error bars corresponding to the extrema of all the relevant data.
|
| Hydrogen [1/m] | Deuterium [1/m] |
|
Rfinal = 1.088e+07
|
Rfinal = 1.101e+07
|
The accepted Rydberg constant is [math]\displaystyle{ R=1.0967758\cdot 10^{7} m^{-1}, }[/math]
and doesn't appear to correlate with my uncertainty. Not a good showing overall.
