William A. C. Gendron 9
From OpenWetWare
Jump to navigationJump to search
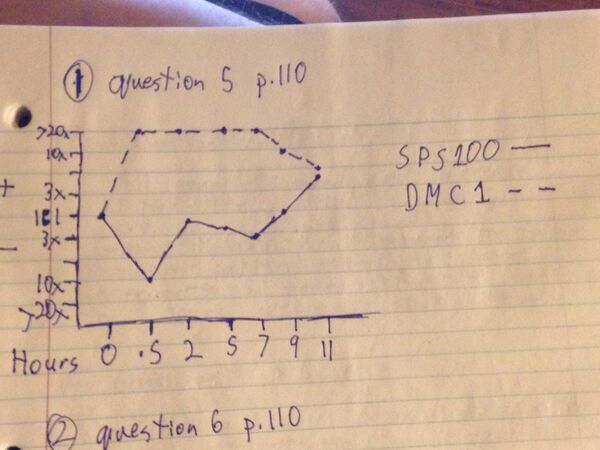
- All of the genes showed an increase after the initial three hours. Genes x and y were relatively correlated. After they all showed the initial increase after 3 hours, they decreased to the baseline amount at 5 hours and then decreased significantly at 9 hours.
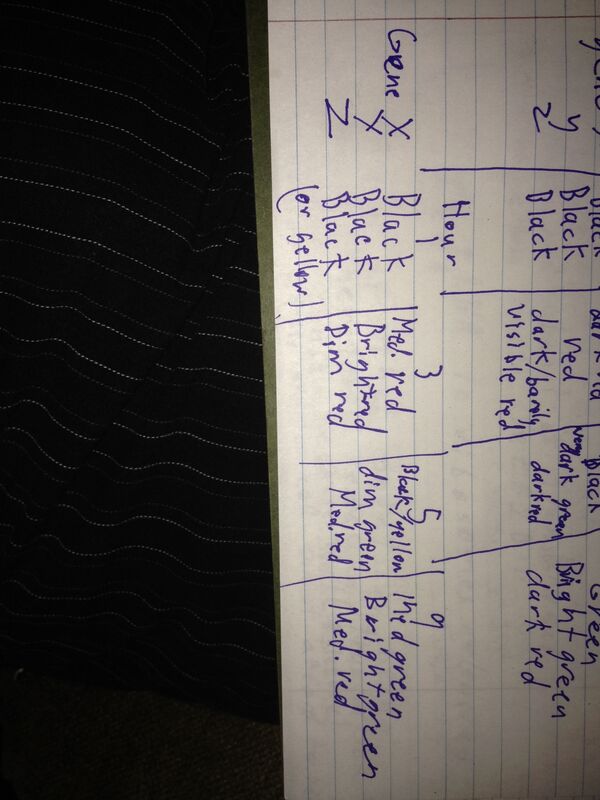
- Most of the spots will be yellow on the first reading because yellow shows that there was not a change between that time and the start. Assuming that the first time point is the standard then all the points with DNA should be yellow except for those absent, because they are the same. This physically works, because the current cDNA fragments are red while the standard or original are green. If there is an even number of these fragments then it will appear yellow.
- TEF4 is being reduced throughout the experiment as glucose decreases. So TEF4 was repressed. TEF4 is responsible for binding tRNA to ribosomes so a decrease in this would decrease translation and therefore slow the metabolism of the cell down. This is useful because it would save energy for the cell if it was acting less and producing less protein.
- The TCA cycle allows the cells to use other molecules instead of glucose as fuel to produce ATP and other energy sources.
- If genes need to be triggered at the same time, they should have similar binding sites upstream of the gene which are position to either to promote or repress activity in the presence of the activating molecule. There will probably be other molecules which work in combination with these binding molecules to modulate it.
- When comparing this mutant lacking the glucose based repressor genes with the wild type, there will be several more red spots or genes that are showing increased activity. These will be the genes that are normally repressed in the presence of TUP1.
- More red spots appear with YAP1 overexpression. This means these specific genes are more active in comparison to the wild type. These will be genes that are activated by YAP1.
- If you want to test whether TUP1 has been sufficiently reduced or YAP1 has been increased, you can run a control with these genes on a microarray. TUP1 should be very green(in the >20 fold difference when analyzing the color). YAP1 should be the opposite that is very red(in the >20 fold difference when the color is analyzed).


