Angela C Abarquez Week 12
Purpose
The purpose is to further analyze Table 1 of the Tai et al (2007) paper and gain a comprehensive understanding of the variables involved. These will then be used to develop a model for a 2-nutrient chemostat simulation in MATLAB.
Methods
- Table 1 in the Tai et al (2007) paper (see "References" section) was analyzed to further understand the variables involved.
- By using the information given in lectures by Dr. Fitzpatrick and referencing the 2005 Tai et al paper, the meanings of the variables were related to a 2-nutrient chemostat model.
- Model parameters were determined and used to create a simulation model for a 2-nutrient chemostat.
- The MATLAB files chemostat_script.m and chemostat_dynamics.m were modified to simulate a 2-nutrient chemostat. These codes can be found in the zipfile here.
- The model was run and results were compared to those in the Tai et al (2007) paper.
Results
- Y Glu/X: This represents the biomass yield on glucose. It compares a ratio of grams of dry weight (biomass) to grams of glucose consumed.
- flux qGlu: This represents the dilution rate, or the ratio of glucose (mmol/gram) being added to the system over 1 hour (t).
- Residuals:
- Glucose @12C:
- Residual glucose: 0.504g
- Residual ammonia: 1.110g
- Glucose @30C:
- Residual glucose: 0.054g
- Residual ammonia: 1.044g
- Ammonium @12C:
- Residual glucose: 16.214g
- Residual ammonia: 0.026g
- Ammonium @30C:
- Residual glucose: 15.331g
- Residual ammonia: 0.003g
- Glucose @12C:
- Time: The data was collected only after values were constant for 3 volume changes, which add up to a total of 100 hours.
- Other parameters:
- r: maximum grown rate
- K: glucose concentration at r/2
- E: glucose efficiency (14.29)
- u: glucose feed concentration (25g/L in C-lim, 46g/L in N-lim)
- q: dilution rate (0.03 h^-1)
- F: ammonium efficiency
- L: ammonium concentration at r/2
- v: ammonium feed concentration (5g/L in C-lim, 0.65g/L in N-lim)
2-nutrient model comparison:
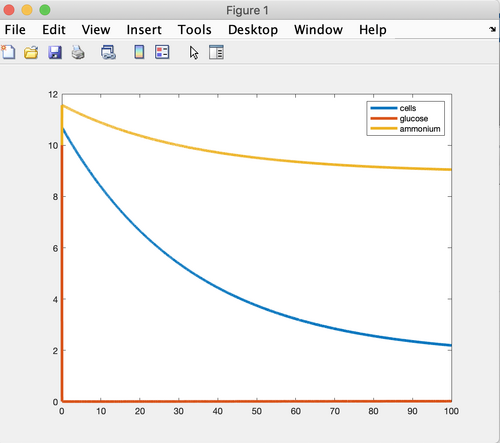
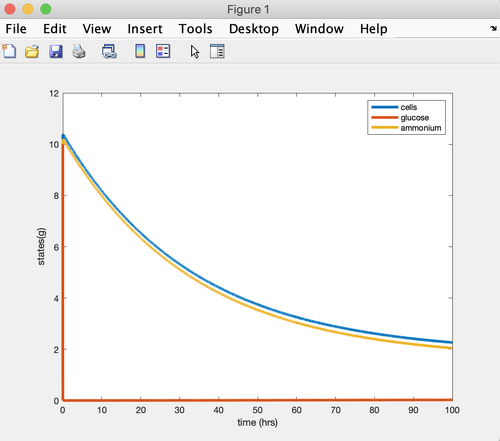
- The graphs developed show the nutrient levels flattening, so it appears that a steady state is being reached. Perhaps if the graphs were extended more the exact leveling off could be seen.
- The steady states in these graphs do not match those in Tai et al's (2007) Table 1.
Data and Files
 Figure 1. MATLAB graph developed using carbon-limited data in 30 degrees C.
 Figure 2. MATLAB graph developed using nitrogen-limited data in 30 degrees C.
MATLAB Files stored in class Box here and on this Wiki here: File:AA chemostat 2nutrient dynamics.m.zip and here: File:AA chemostat 2nutrient script.m.zip
MATLAB Scripts:
C-limited: File:AA chemostat 2nutrient script Clim.pdf
N-limited: File:AA chemostat 2nutrient script Nlim.pdf
Conclusion
By going into depth with Table 1 from the Tai et al (2007) paper, a deeper understanding of the variables was developed. The exact values for some parameters were calculated and used to create a 2-nutrient chemostat model which was run on MATLAB. The graphs developed from this model showed different steady states than those in Tai et al's (2007) Table 1. The carbon-limited environment showed a high level of ammonium which flattens out to a steady state. Both graphs show glucose to be immediately consumed.
Acknowledgments
I worked with my homework partner, [User:Alison S King | Ali] on this assignment. We texted throughout the week to discuss the variables and their meanings.
Dr. Fitzpatrick also helped in class on 4/23 and 4/25 with MATLAB and breaking down the derivation of certain variables.
Except for what is noted above, this individual journal entry was completed by me and not copied from another source.
Angela C Abarquez (talk) 14:48, 25 April 2019 (PDT)
References
Loyola Marymount University (23 April 2019) BIOL388/S19:Week 12. Retrieved from https://openwetware.org/wiki/BIOL388/S19:Week_12 on 23 April 2019.
Quick Links
User Page: Angela Abarquez
Course Homepage:BIOL388/S19
Assignments:
Week 1: Instructions and Class Journal
Week 2: Instructions and Class Journal and Individual Journal
Week 3: Instructions and Class Journal and Individual Journal
Week 4/5: Instructions and Class Journal and Individual Journal
Week 6: Instructions and Class Journal and Individual Journal
Week 7/8: Instructions and Class Journal and Individual Journal
Week 9: Instructions and Class Journal and Individual Journal
Week 10: Instructions and Class Journal and Individual Journal
Week 11: Instructions and Class Journal and Individual Journal
Week 12: Instructions and Class Journal and Individual Journal
Week 14/15: Instructions and Individual Journal