James C. Clements: Week 4
From OpenWetWare
Jump to navigationJump to search
Lab Journal Navigator
Terminology
- Explain the following terms in your own words.
- The Michaelis-Menten model of enzyme kinetics.
- A simplified model of enzyme kinetics in which the rate of substrate use is able to be found using its (and only its) concentrations and the rate of product formation is the negative of the rate of substrate use.
- The experiment required for the Lineweaver-Burk approach to estimating parameters for Michealis-Menten.
- The concentrations of substrate must be measured for different time intervals in so that the amount of concentration and the reaction velocity can be used to construct the Lineweaver-Burk plot.
- Chemostat reactor.
- A container in which feed is added to a substance and effluent is removed. This allows for the addition of nutrients for organisms and the removal of their waste. Enzymatic reactions are frequently analyzed in a chemostat reactor.
- Exponential growth.
- When the increase of a substance is proportional to the amount of substance at the current instance of interest.
Applying Michealis-Menten Models
- Consider a single substrate being converted to product.
E + S ↔ ES → E + P
with an initial substrate concentration of 1.0 and an initial enzyme concentration of 0.05. Use the Michaelis-Menten matlab model to explore the following.


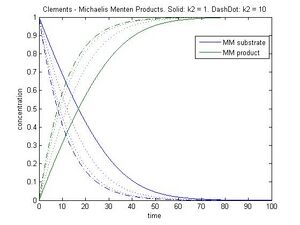
- Set k1 = 2.0, k-1 = 0.0. Plot the substrate dynamics for k2 = 1.0, k2 = 2.0, k2 = 5.0, k2 = 10.0 all on the same graph to see the effect of this parameter.
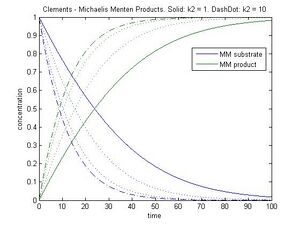
- Set k1 = 2.0, k-1 = 1.0. Plot the substrate dynamics for k2 = 1.0, k2 = 2.0, k2 = 5.0, k2 = 10.0 all on the same graph to see the effect of this parameter.
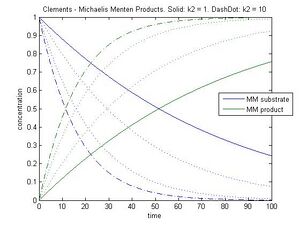
- Set k1 = 2.0, k-1 = 5.0. Plot the substrate dynamics for k2 = 1.0, k2 = 2.0, k2 = 5.0, k2 = 10.0 all on the same graph to see the effect of this parameter.
Estimating Michaelis-Menten Parameters
- Consider the following data:
[S] = 11.0, 16.7, 20.0, 25.0, 33.3, 50.0
V = 0.00952, 0.01111, 0.01282, 0.01515, 0.01852, 0.02128
Apply the Lineweaver-Burk technique to determine Vmax and K.
Vmax = .0316
K = 27.11