James C. Clements: Week 5
Lab Journal Navigator
Simple Chemostat Model of Nutrients and Population Growth Analysis
Scripts were created in MatLab for the Chemostat Malthus and Logistic models of Nutrients and Population growth and the parameters and initial conditions were varied.
For each model, the standard values for parameters and initial conditions were as follows:
- time, t: ranged from 0 to 10
- Michaelis Menton reaction constant, K: 1
- Reaction maximum velocity, Vmax: 5
- Population growth rate, r: 1
- Dilution rate, D: 1
- Feed concentration, u: 1
- Max population parameter, A : 10 (only used in logistic model)
- Initial nutrient concentration, n0: 1
- Initial yeast concentration, y0: 1
Parameters and initial conditions were varied one by one from 1 to 10 and the results were plotted below.
Malthus Model
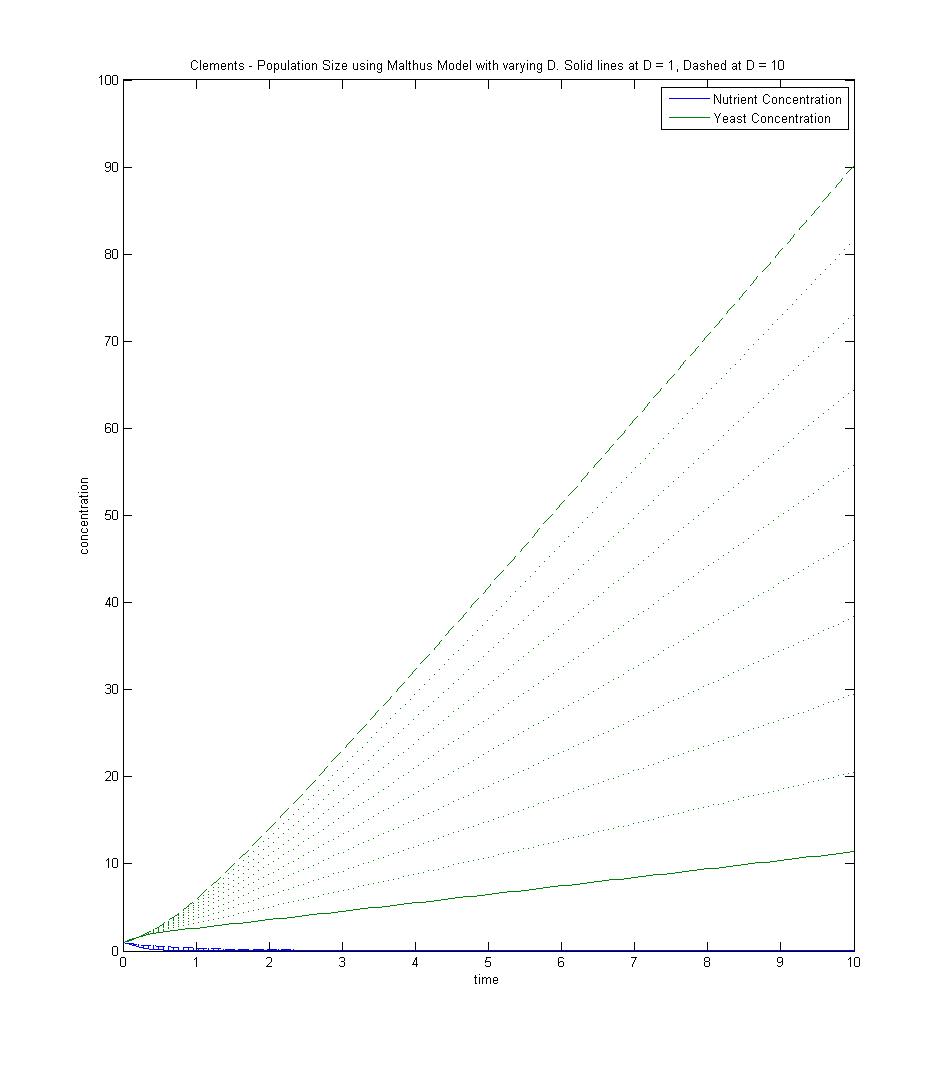
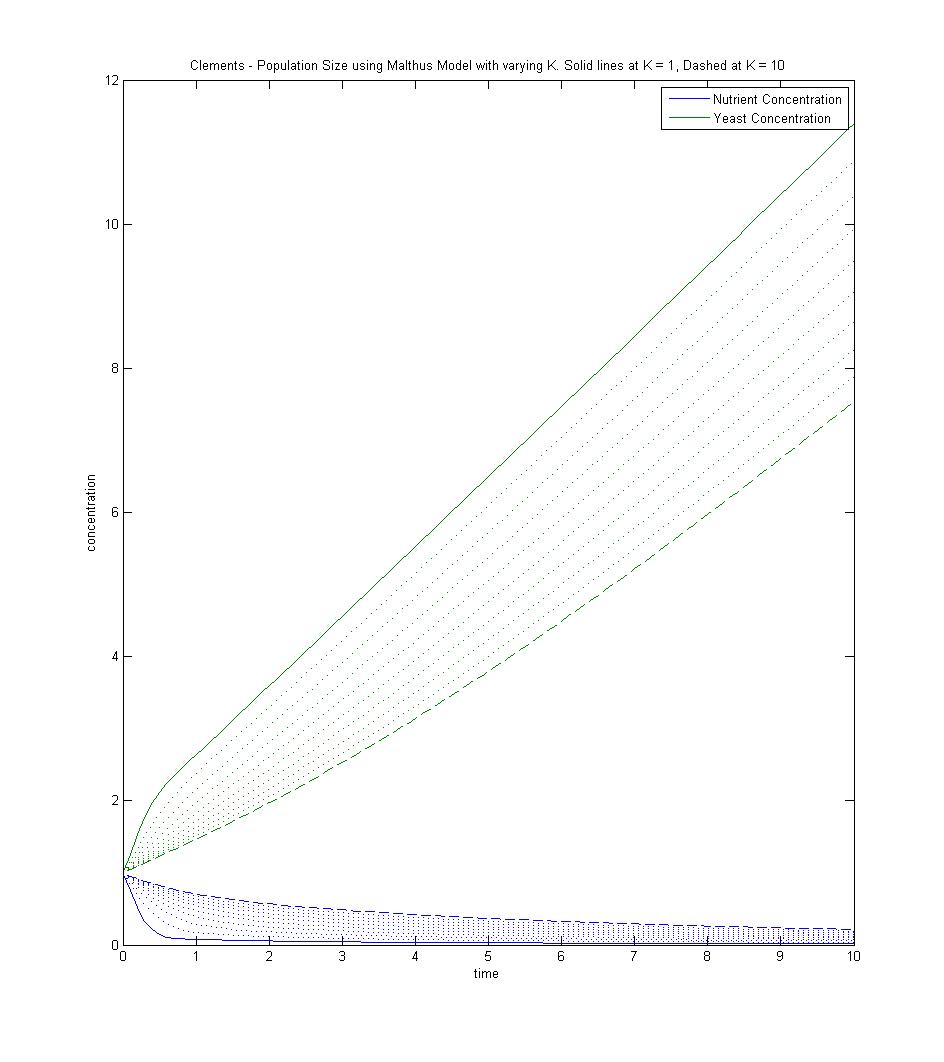
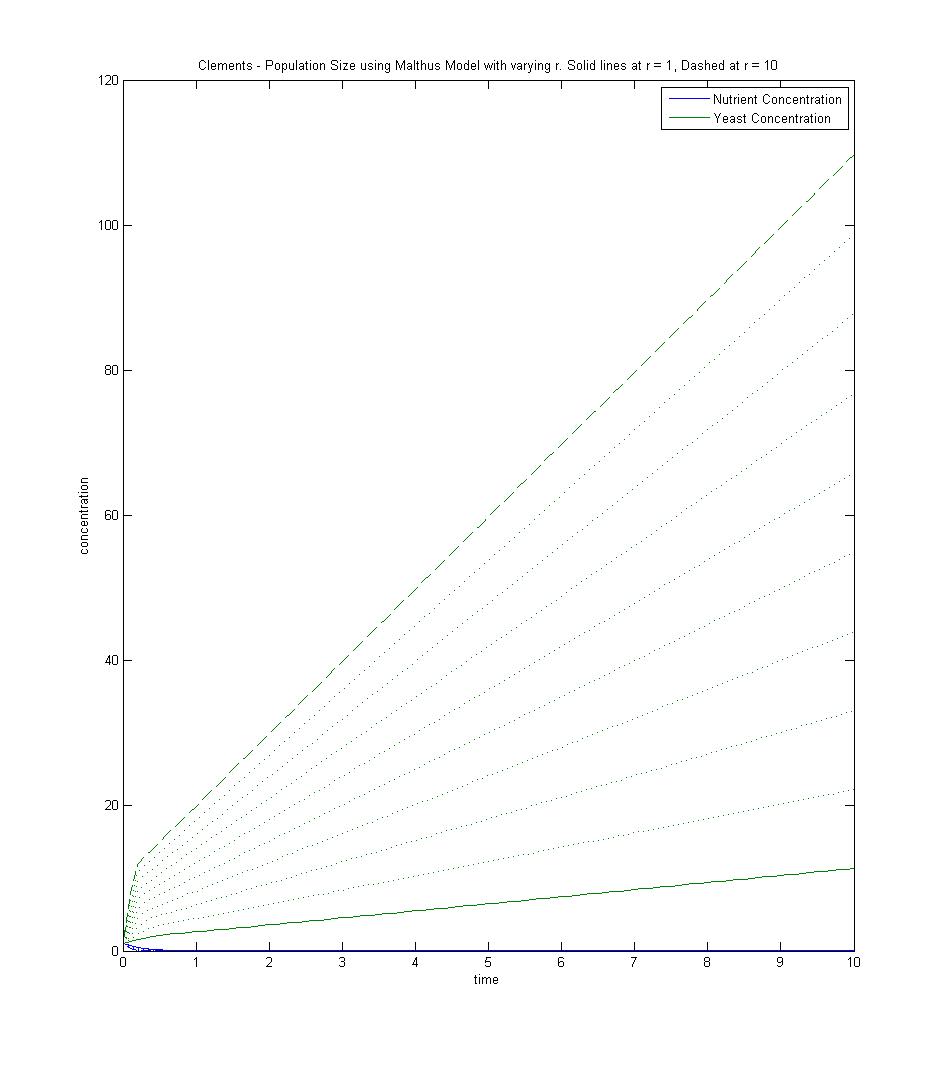
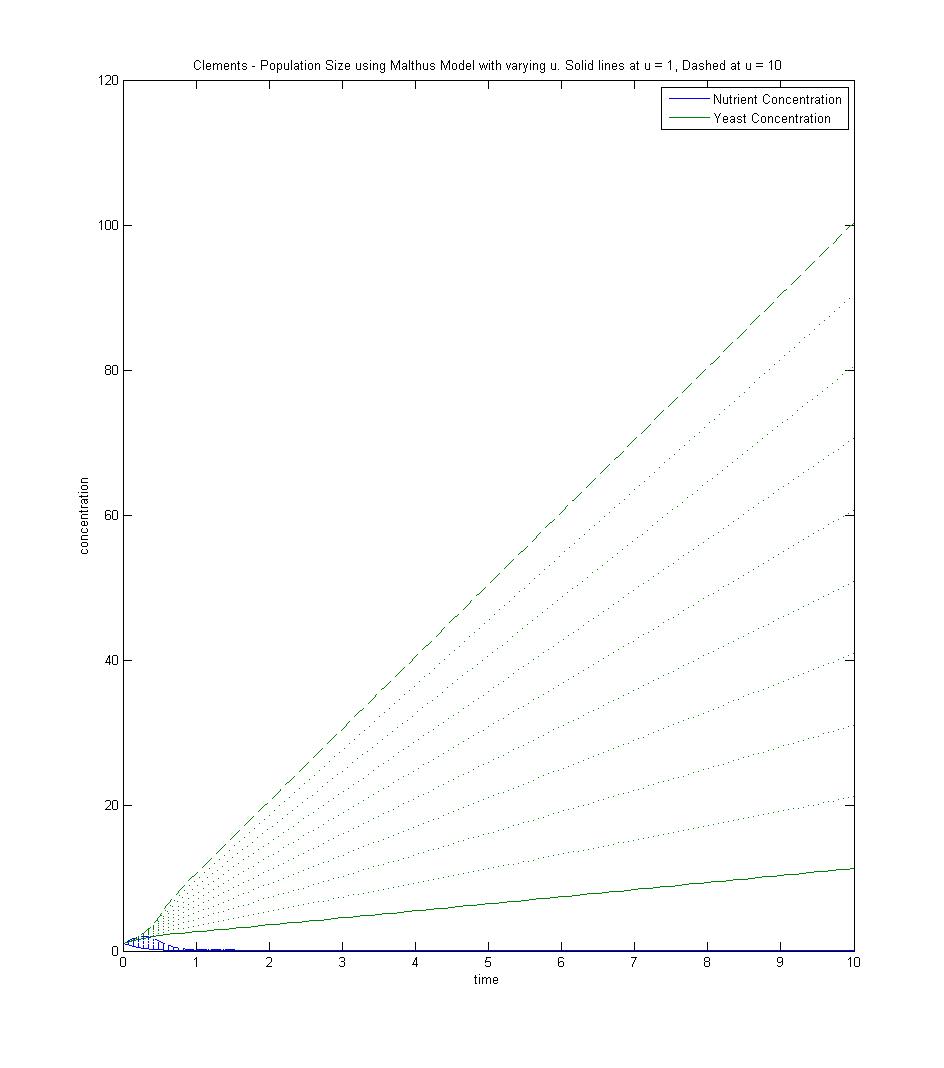
It was observed in each of the Malthus plots that at early time values, the concentrations undergo a sort of transient state; after this the rate of change for the concentrations becomes constant. The time at which this transition occurs is constant for some of the parameters and varies for others. The effect of altering each parameter is described below.
In each of the plots of the Malthus Model, the amount of yeast continues to grow as nutrients are depleted.
In this discussion, it is mentioned that derivatives are increased and decreased. Increased is defined as brought closer to infinity (either positive or negative) and decreased means brought closer to zero. The effect of increasing something like dy/dt makes its line have a steep slope where as decreasing it gives it a flatter slope.
- D: the rate of increase in the yeast concentration (dy/dt) increased as D was increased. Increasing D also decreased the rates of nutrient concentration loss (dn/dt) (in other words, it brought the rate closer to zero). D had a tremendous effect on the final yeast concentration.
- K: lower K values resulted in an increase of dy/dt brought dn/dt closer to 0. Decreasing K increased the final yeast concentration. Increasing K also increased the time to reach a steady state of the rate of concentration change.
- R: Increasing R increased dy/dt and decreased dn/dt. It also had a strong effect on the final yeast concentrations. All of the nutrient concentration levels began to approach zero at around t = 0.5
- U: increases in U increased both dy/dt and dn/dt. Values for n initially increased and then approached 0 as it was consumed by the growing yeast population. U also had a strong effect on the final yeast concentrations. Small values of U caused the model to quickly reach steady state.
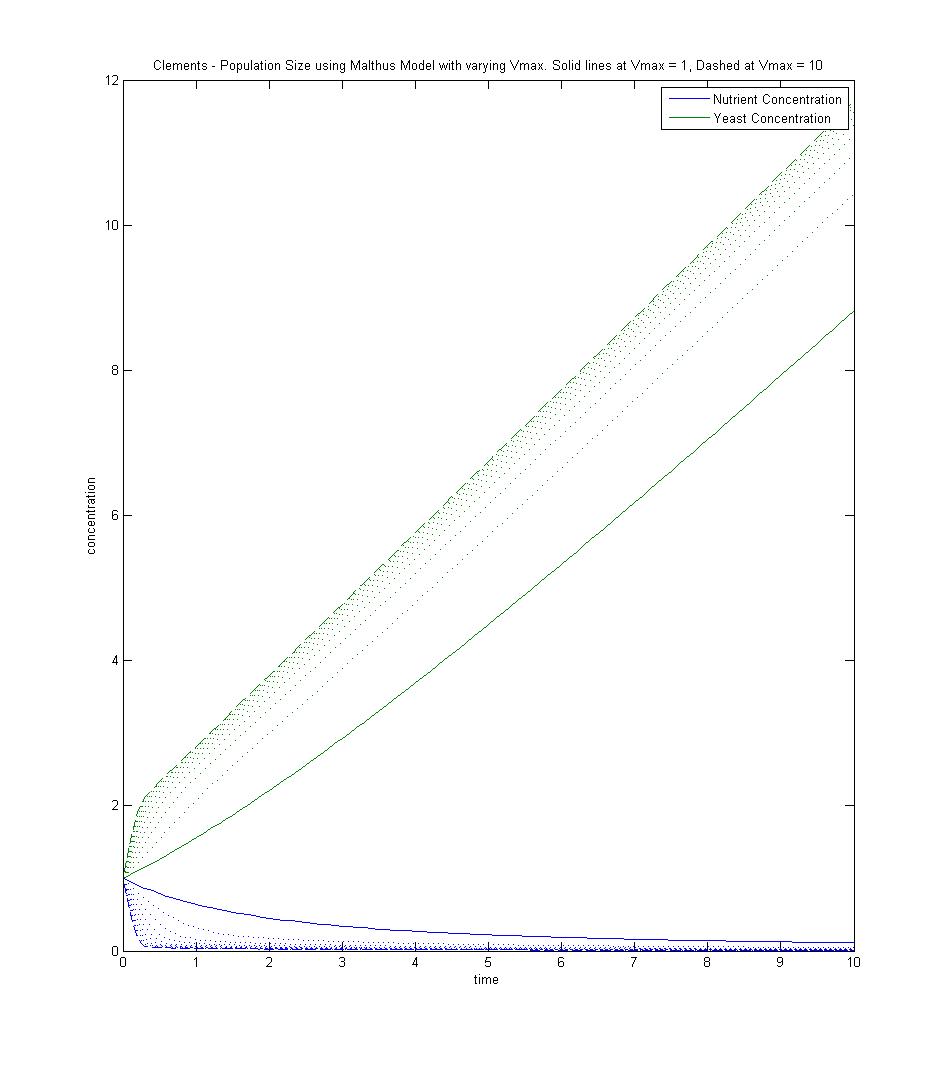
- Vmax: Increasing Vmax increased dy/dt and dn/dt. Increasing Vmax decreased the time it took to each steady state. An interesting observation from the plot of yeast concentration is that for Vmax values of 1-9 the plot of y is concave down but for Vmax = 10 the plot is concave up.
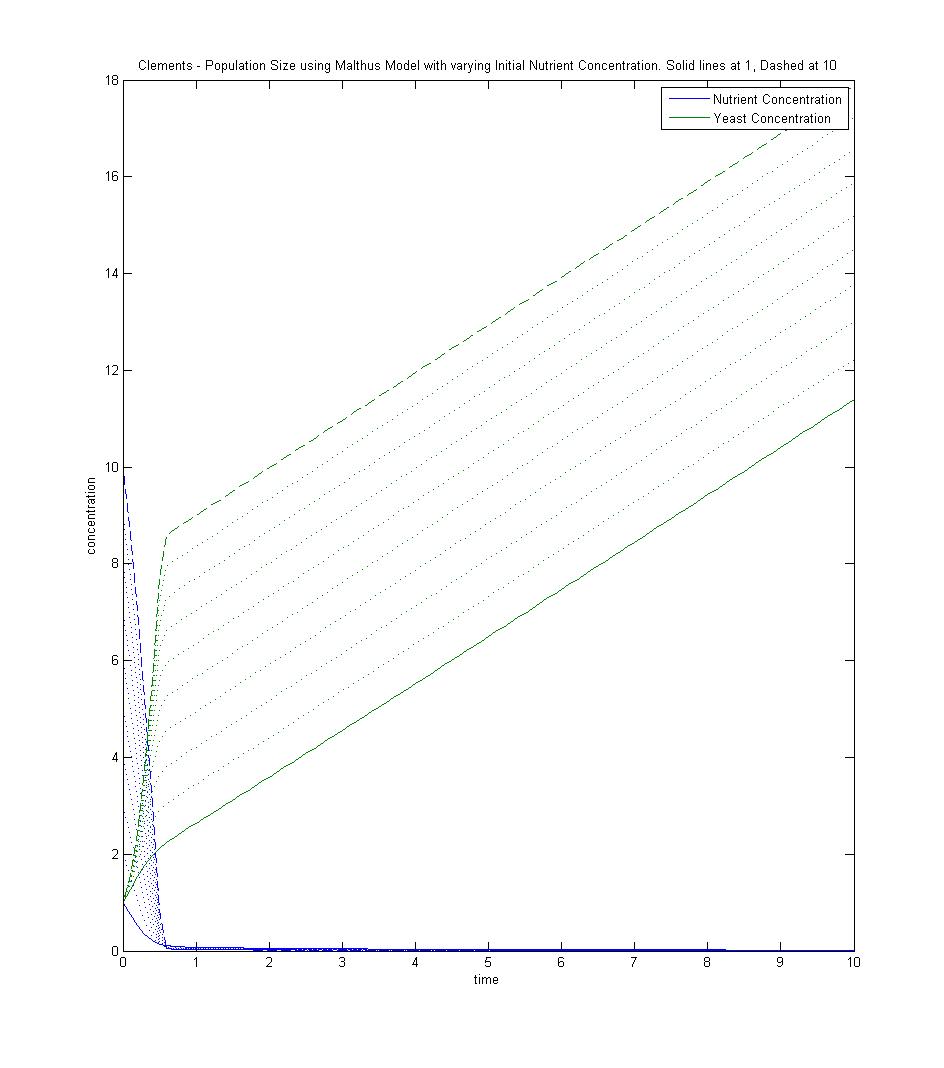
- n0: Increasing n0 increased dn/dt, and the early values dy/dt. At steady state however, dy/dt remained constant. Increasing n0 decreased the time it took to reach steady state.
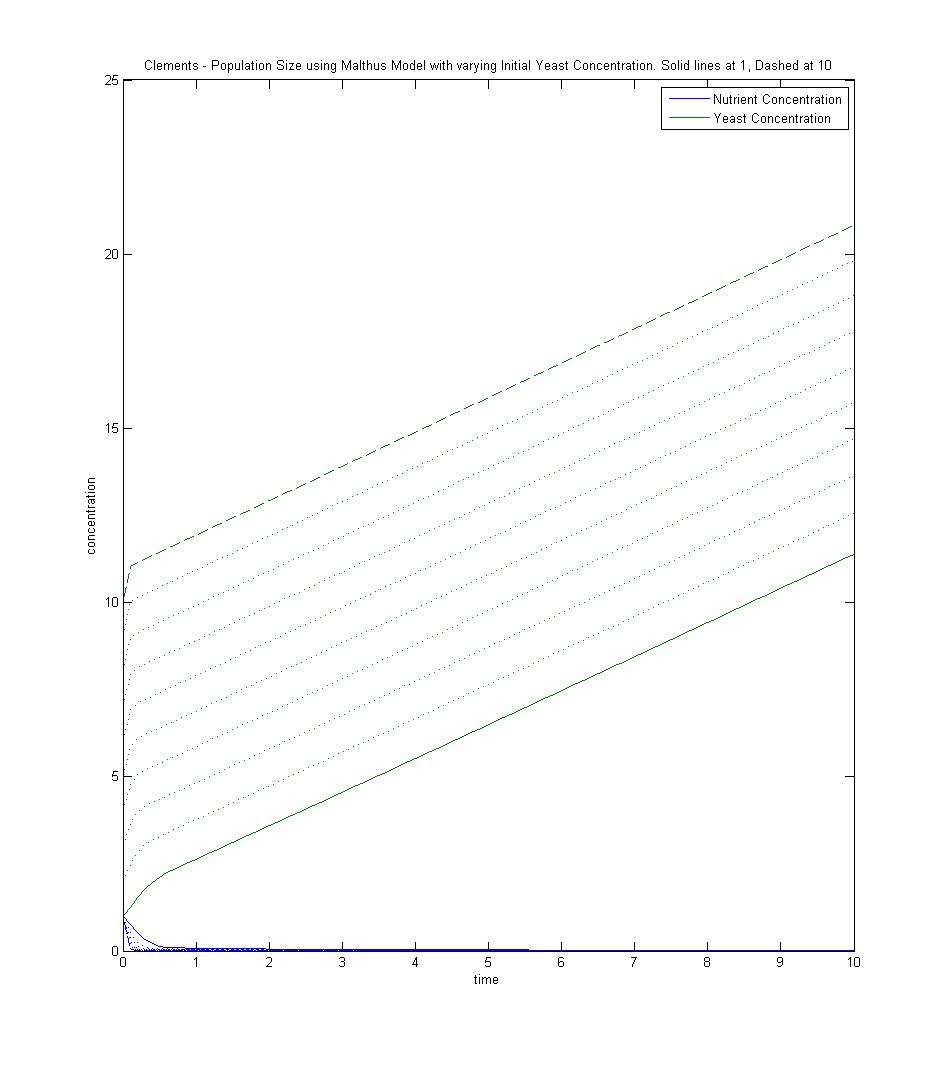
- y0: Increasing y0 decreased the time to reach steady state. It had a negligible effect on the steady state values of dy/dt. Increasing y0 increased dn/dt.
Malthus Images
Logistic Model
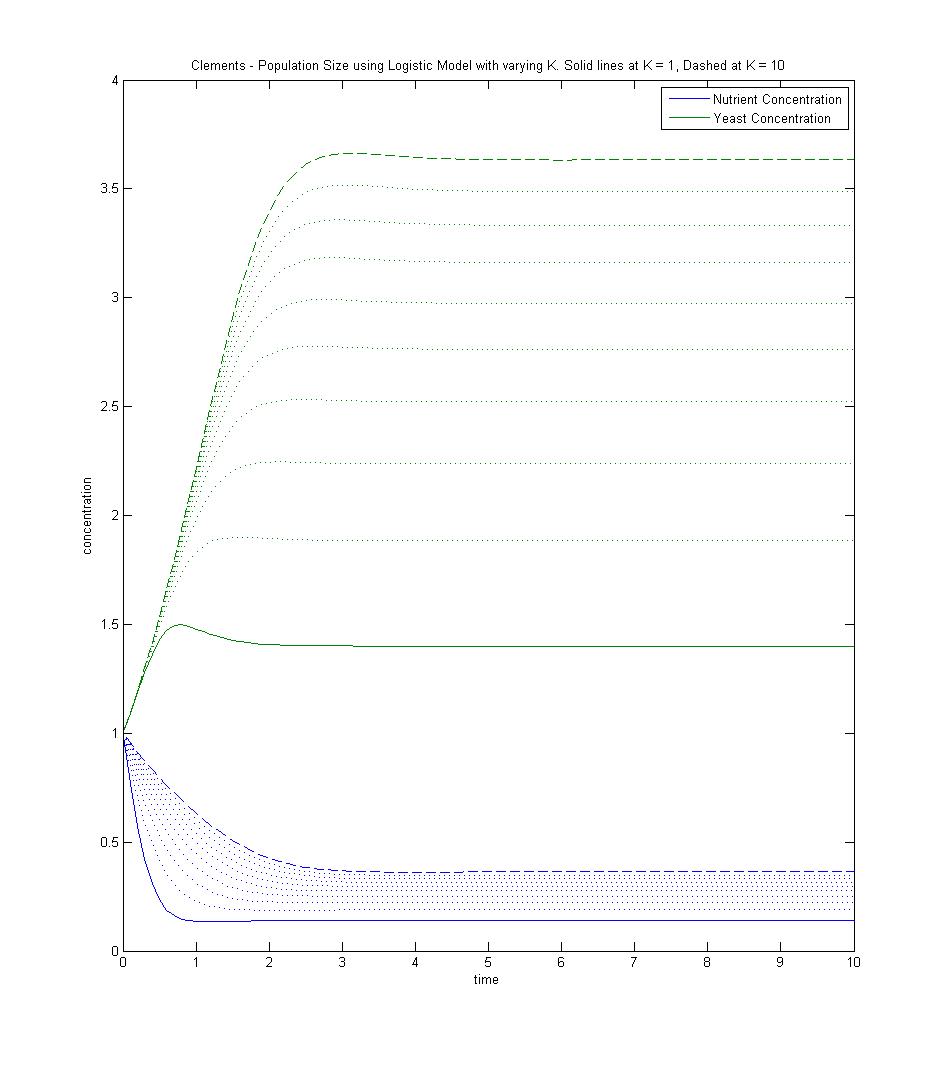
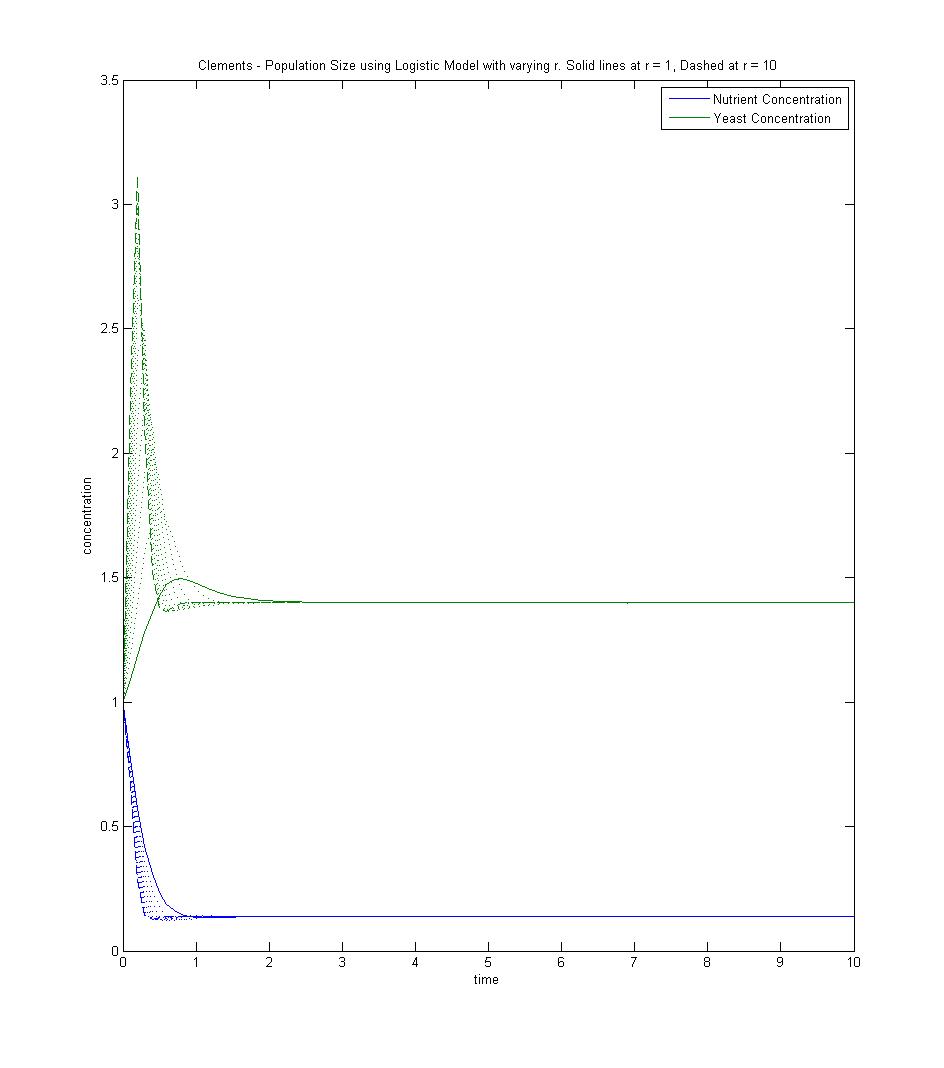
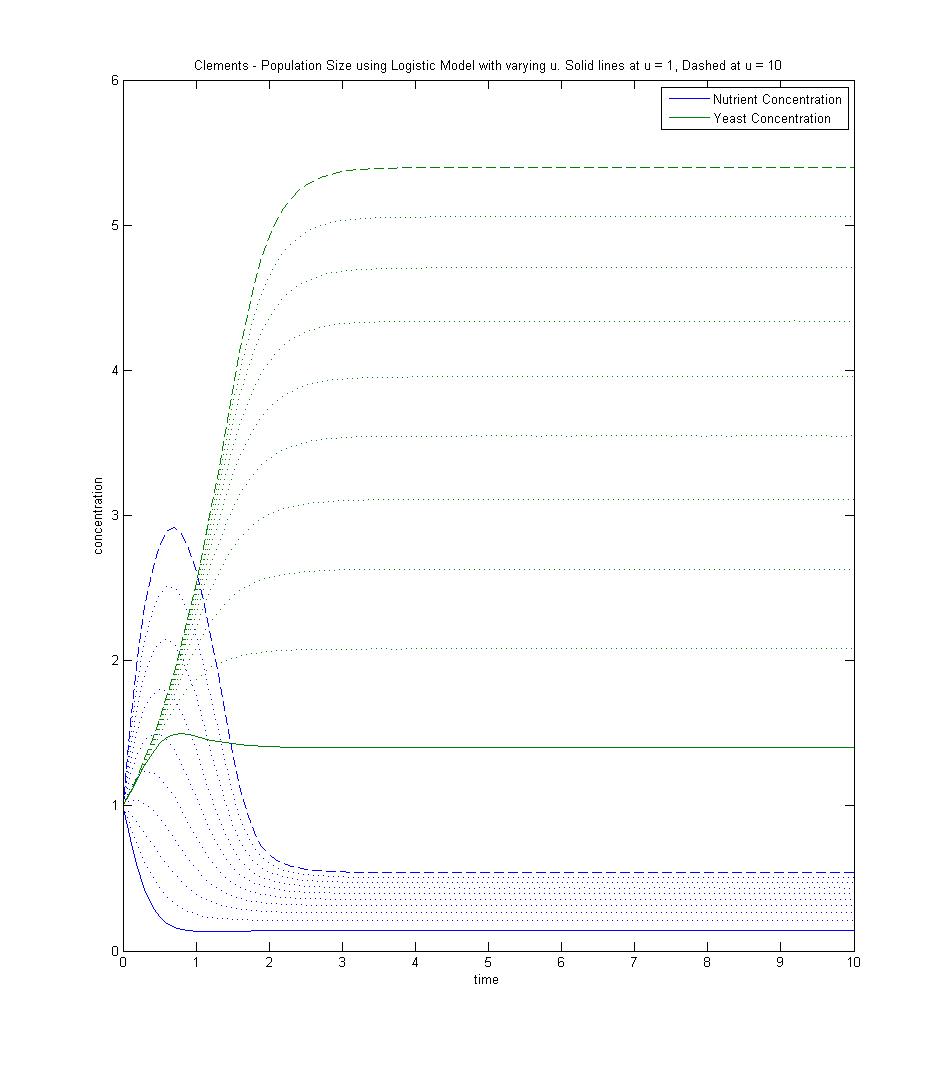
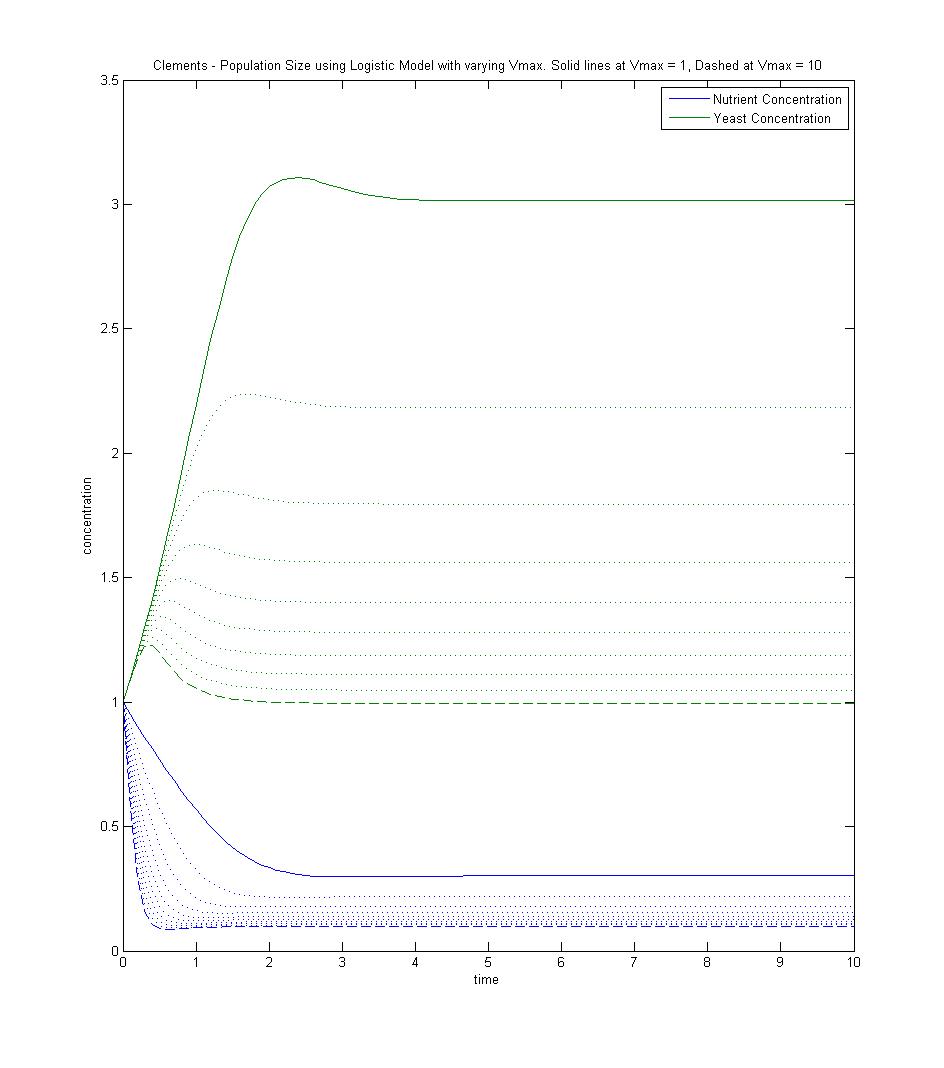
It was observed in each of the Logistic plots that at early time values, the concentrations undergo a sort of transient state; after this the rate of change for the concentrations becomes constant. The time at which this transition occurs is constant for some of the parameters and varies for others. The effect of altering each parameter is described below.
In each of the plots of the logistic model, the yeast population ceases to increase as its nutrient become limiting and it reaches its population limit.
In this discussion, it is mentioned that derivatives are increased and decreased. Increased is defined as brought closer to infinity (either positive or negative) and decreased means brought closer to zero. The effect of increasing something like dy/dt makes its line have a steep slope where as decreasing it gives it a flatter slope.
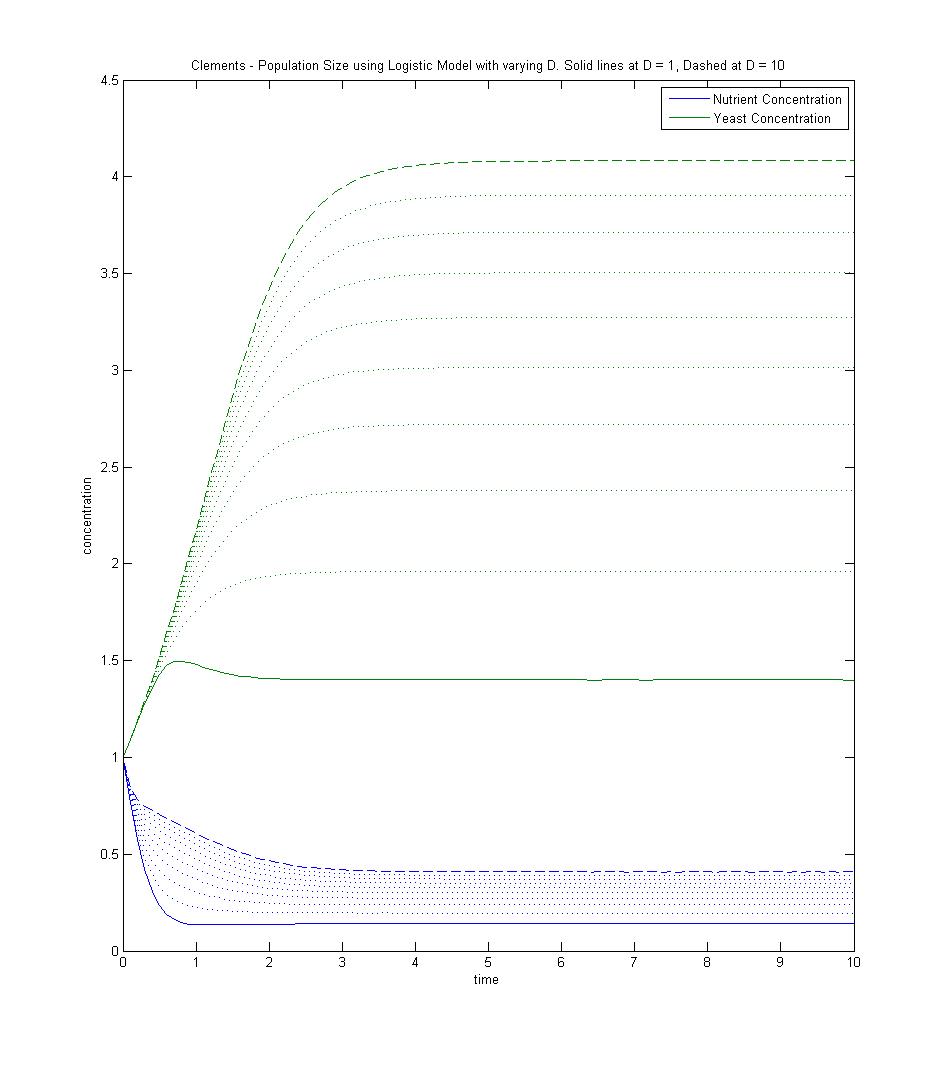
- D: The initial rates of change were constant for all values of D, the time required for transition to steady state was increased as D was increased. For D=1, the concentration of yeast increased to a maximum and then decreased to an asymptote. For other values of D, the plot continuously approached an asymptote. The value of this asymptote increased as D was increased. At steady state, dy/dt and dn/dt was zero.
- K: Varying K followed a similar pattern as varying D. One difference was that for plots of yeast concentration, dy/dt started out as positive, decreased past zero and then approached zero for steady state.
- R: Varying R did not effect the final concentrations. It did effect the transient phase in a similar way to how varying K did.
- U: the yeast concentrations from varying U followed a similar trend to varying D. The transient phase for the concentration of nutrient was greatly affected by altering U; for small values of U, n decreased to an asymptote, for large values of U, dn/dt started out as positive, decreased past zero and then approached zero for steady state.
- Vmax: Decreasing Vmax had a similar effect on the plots as increasing K.
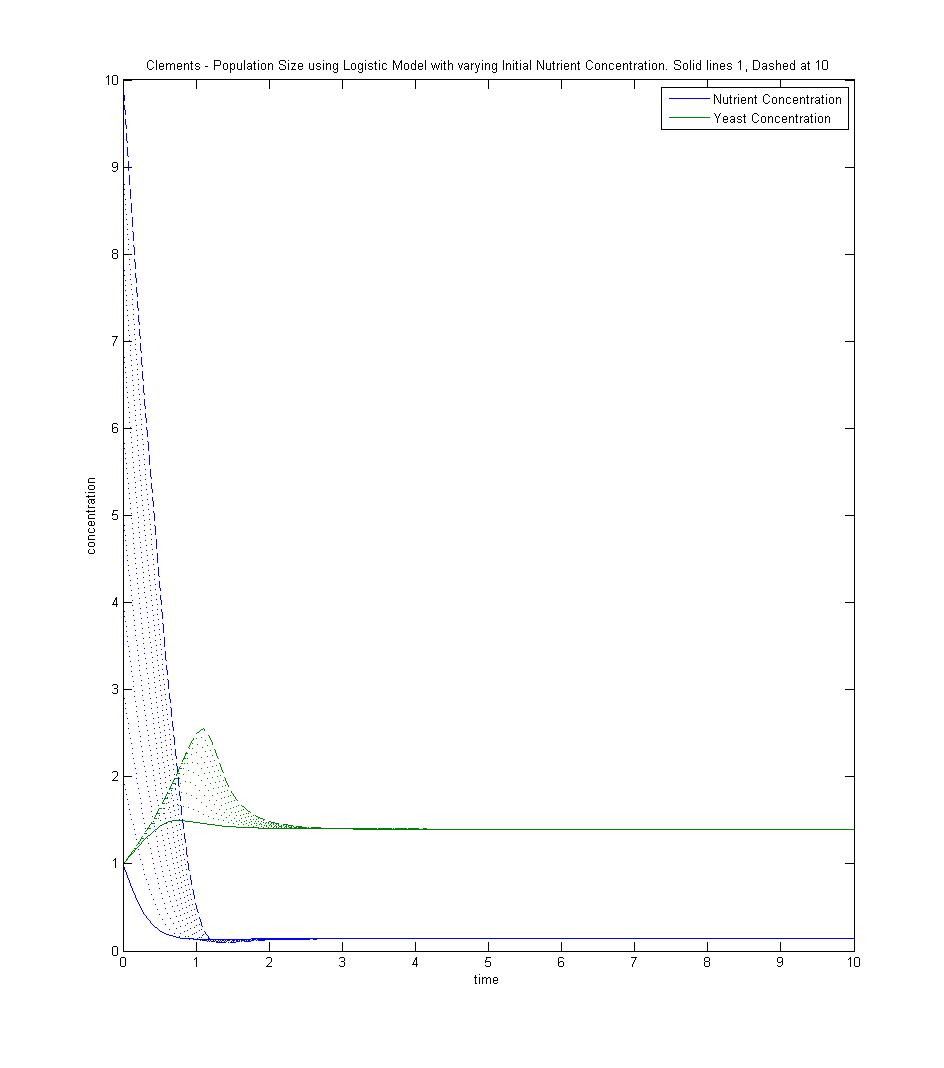
- n0: varying n0 did not effect the final concentrations but increasing it increased the time it took to reach steady state. Increasing n0 also caused the yeast plot to reach a higher maximum and caused the nutrient plot to reach a lower minimum.
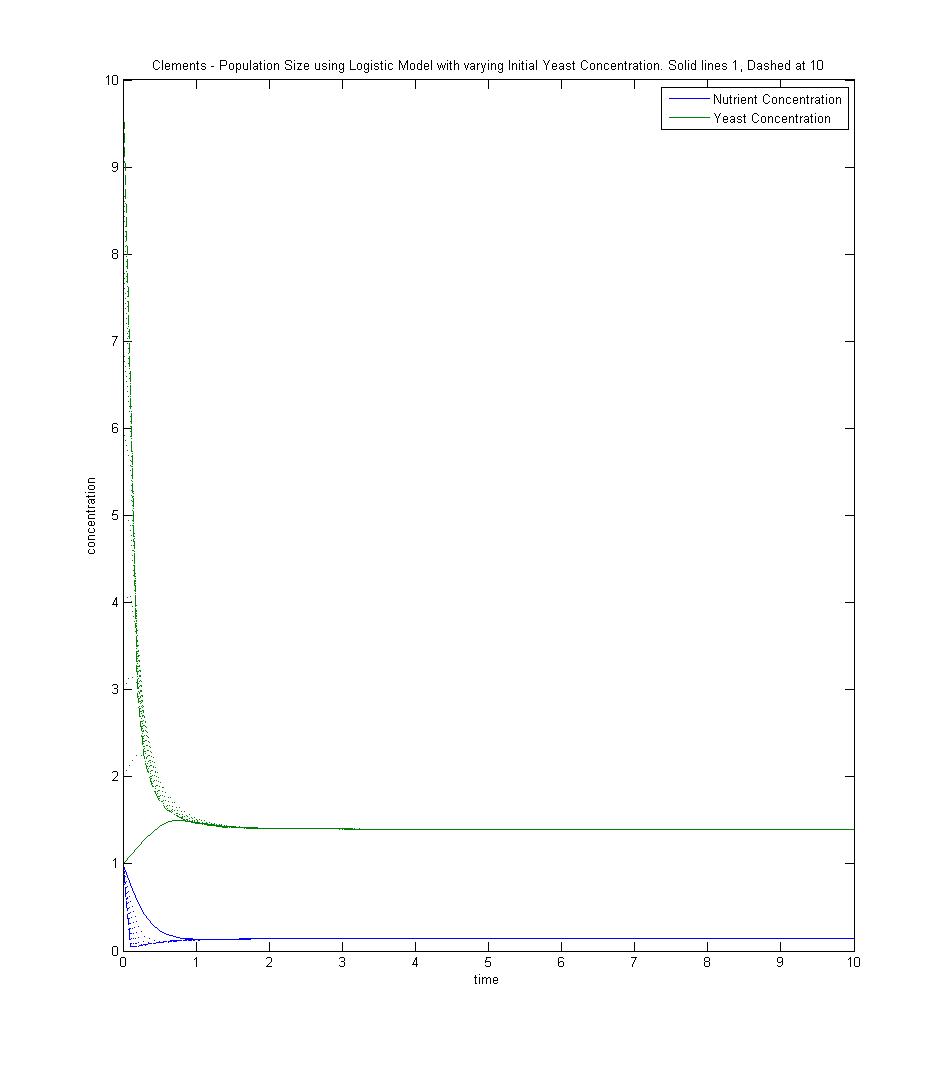
- y0: Varying y0 did not have an effect on the final concentrations, but it changed the transient phase in a similar manner to varying n0.
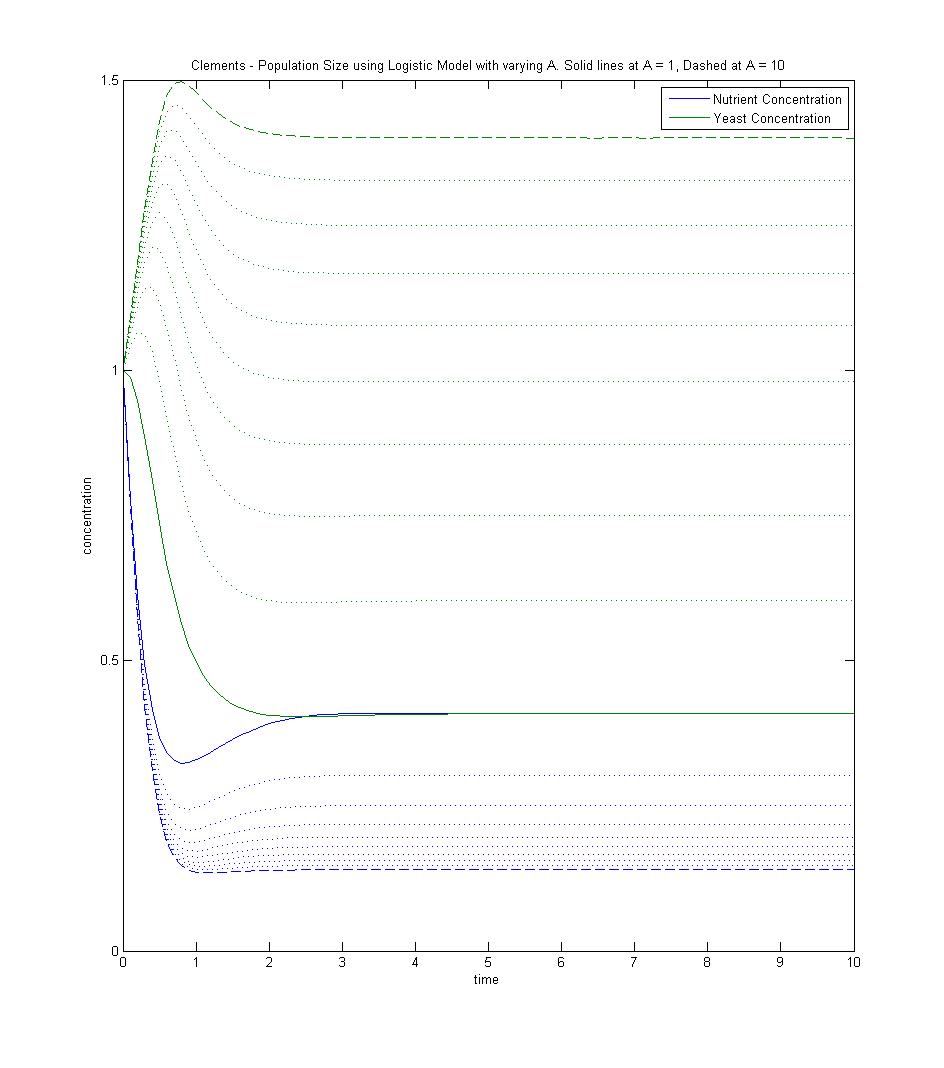
- A: Increasing A decreased the final amount of nutrient, increased the final amount of yeast, and decreased the amount of time it took to reach steady state.
